
Introduction
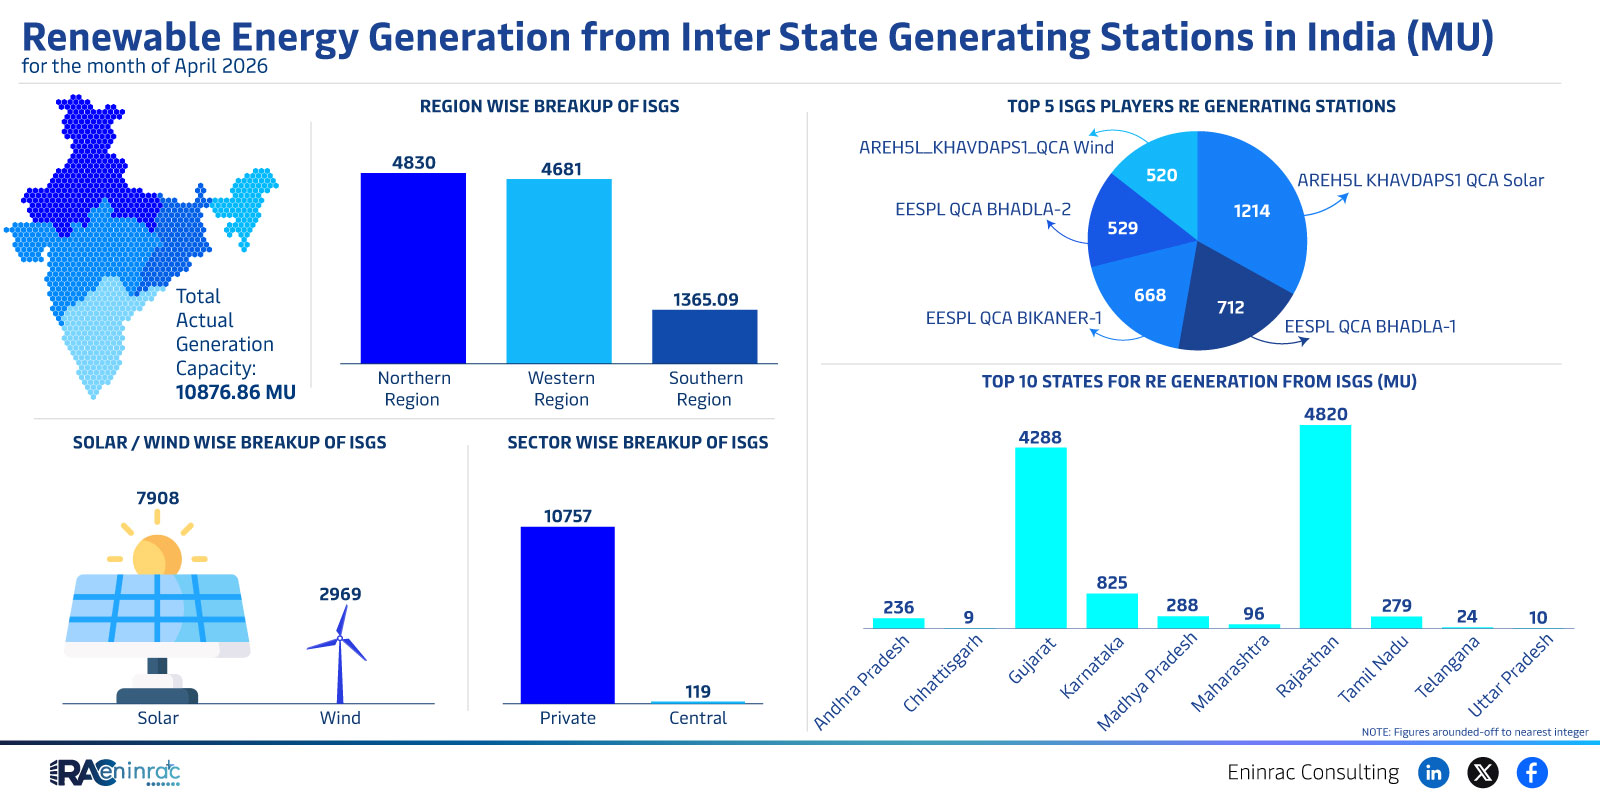
India's inter‑state generating stations (ISGS) delivered a combined 10,876.86 MU of renewable energy in April 2026. The data breaks down generation by region, state, sector and the top five ISGS players, highlighting the growing contribution of wind and solar across the country. This article explains the key figures, compares regional performance, and discusses what the numbers mean for investors, policymakers and the energy market.
What Does the Data Reveal About This Topic?
The raw figures show that wind contributed 4,830 MU while solar added 4,288 MU, together accounting for the majority of ISGS output. Northern and western regions lead with the highest totals, and the top five ISGS operators dominate the market. The question is: why are these regions and players outperforming others, and what trends can be expected?
Regional and Sectoral Performance Overview
North and West regions together generated over 7,900 MU, far exceeding South and East contributions. Wind generation is strongest in the western states, whereas solar output is concentrated in the north. The top ten states for ISGS renewable generation collectively produced more than 8,000 MU, underscoring the geographic concentration of renewable assets. Private and central sector players together supplied roughly 7,500 MU, while state‑run entities contributed the remainder.
Impact on Sectors and Industries
These generation levels influence multiple sectors. Power utilities gain access to cleaner energy, reducing reliance on coal and lowering emissions. Investors see heightened confidence in renewable projects, especially in wind‑rich western corridors and solar‑rich northern zones. Policymakers can use the data to target subsidies and grid upgrades where capacity is expanding fastest. Consumers benefit from more stable electricity prices as renewable supply grows.
Key Takeaways
- Wind and solar together supplied over 9,100 MU, representing the bulk of ISGS renewable output in April 2026.
- Northern and western regions outperformed the south and east, driving the majority of generation.
- The top five ISGS operators accounted for the largest share of renewable production.
- Private and central sector participants contributed the majority of generation, highlighting strong non‑state involvement.
- Top ten states generated more than 8,000 MU, indicating regional clustering of renewable assets.
- Growth in ISGS renewable output supports emission reduction goals and encourages further investment.
FAQs
Which renewable source led ISGS generation in April 2026?
Wind generation led with 4,830 MU, slightly ahead of solar.
Which regions produced the most renewable energy?
The north and west regions together produced the highest totals, exceeding 7,900 MU.
Who are the major players in ISGS renewable generation?
The top five ISGS operators, including AREHSL_KHAVDAPS1_QCA and EESPL QCA BHADLA‑2, dominate the market.
How does private sector participation compare to central sector?
Private and central sectors together supplied roughly 7,500 MU, outpacing pure state contributions.
What does this data mean for future renewable investment?
Strong generation figures in wind‑rich western states and solar‑rich northern states signal attractive opportunities for further renewable investment and grid development.