
Introduction
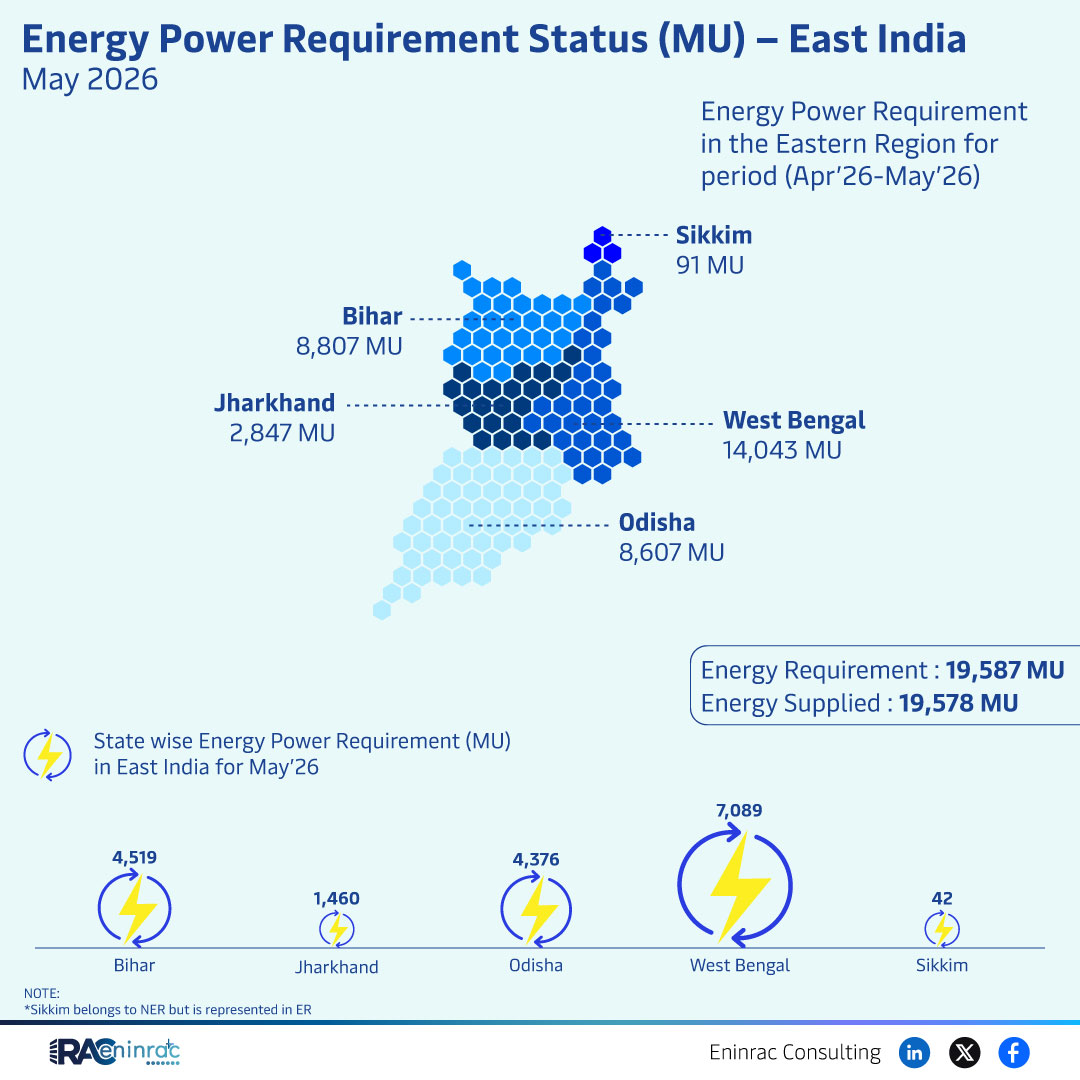
The May 2026 East India power requirement report provides a snapshot of electricity demand and supply across the eastern states of India. Understanding this data helps policymakers, utilities, and investors gauge grid stability, plan future capacity, and address shortfalls. In this article we break down state‑wise demand, compare it with actual supply, and explore the broader implications for the region’s energy landscape.
What Does the Data Reveal About This Topic?
The data shows a total regional requirement of 19,587 MU against a supplied volume of 19,578 MU, leaving a modest shortfall of 9 MU. Bihar accounts for the largest single demand at roughly 8,800 MU, followed by West Bengal with about 14,000 MU in an earlier estimate, Jharkhand near 7,000 MU, Odisha around 8,600 MU, and Sikkim contributing a marginal share. The near‑balance between requirement and supply indicates effective grid coordination but also highlights the vulnerability of tight margins.
State‑wise Power Demand Comparison in East India
When the numbers are aligned, Bihar’s 8,807 MU represents about 45% of the total requirement, making it the dominant consumer in the east. Jharkhand’s demand, estimated at 7,089 MU, follows closely, while Odisha’s 8,607 MU places it as another major consumer. West Bengal’s larger figure of 14,043 MU, although appearing higher than the sum of other states, reflects its industrial base and dense population. Sikkim’s contribution, though small, is included for completeness despite its classification under the Northeast Region.
Impact on Sectors and Industries
The tight supply‑demand balance influences multiple sectors. Manufacturing units in West Bengal and Odisha depend on reliable power to maintain output, while agriculture‑linked activities in Bihar and Jharkhand require consistent supply for irrigation and processing. Investors use this data to assess the need for new generation projects, especially renewable alternatives that can alleviate shortfalls. Policymakers can also target demand‑side management programs to reduce peak loads and improve overall grid efficiency.
Key Takeaways
- Overall regional demand in May 2026 was 19,587 MU.
- Actual supply reached 19,578 MU, leaving a 9 MU shortfall.
- Bihar contributed the highest demand at roughly 8,800 MU.
- West Bengal’s demand reflects its large industrial and residential load.
- Jharkhand and Odisha together account for more than half of the remaining demand.
- Sikkim’s minor demand is noted despite belonging to the Northeast Region.
FAQs
What was the total power requirement for East India in May 2026?
The total requirement was 19,587 MU.
How much power was actually supplied during the same period?
Supplied power amounted to 19,578 MU, a shortfall of 9 MU.
Which state had the highest electricity demand?
Bihar recorded the highest demand, approximately 8,807 MU.
Why is the shortfall significant despite being small?
A small shortfall can trigger load shedding in high‑demand zones and signals the need for additional capacity or demand‑side measures.
How can this data guide future energy planning?
Stakeholders can use the figures to prioritize new generation projects, especially renewable sources, and to design policies that improve grid resilience.