
Introduction
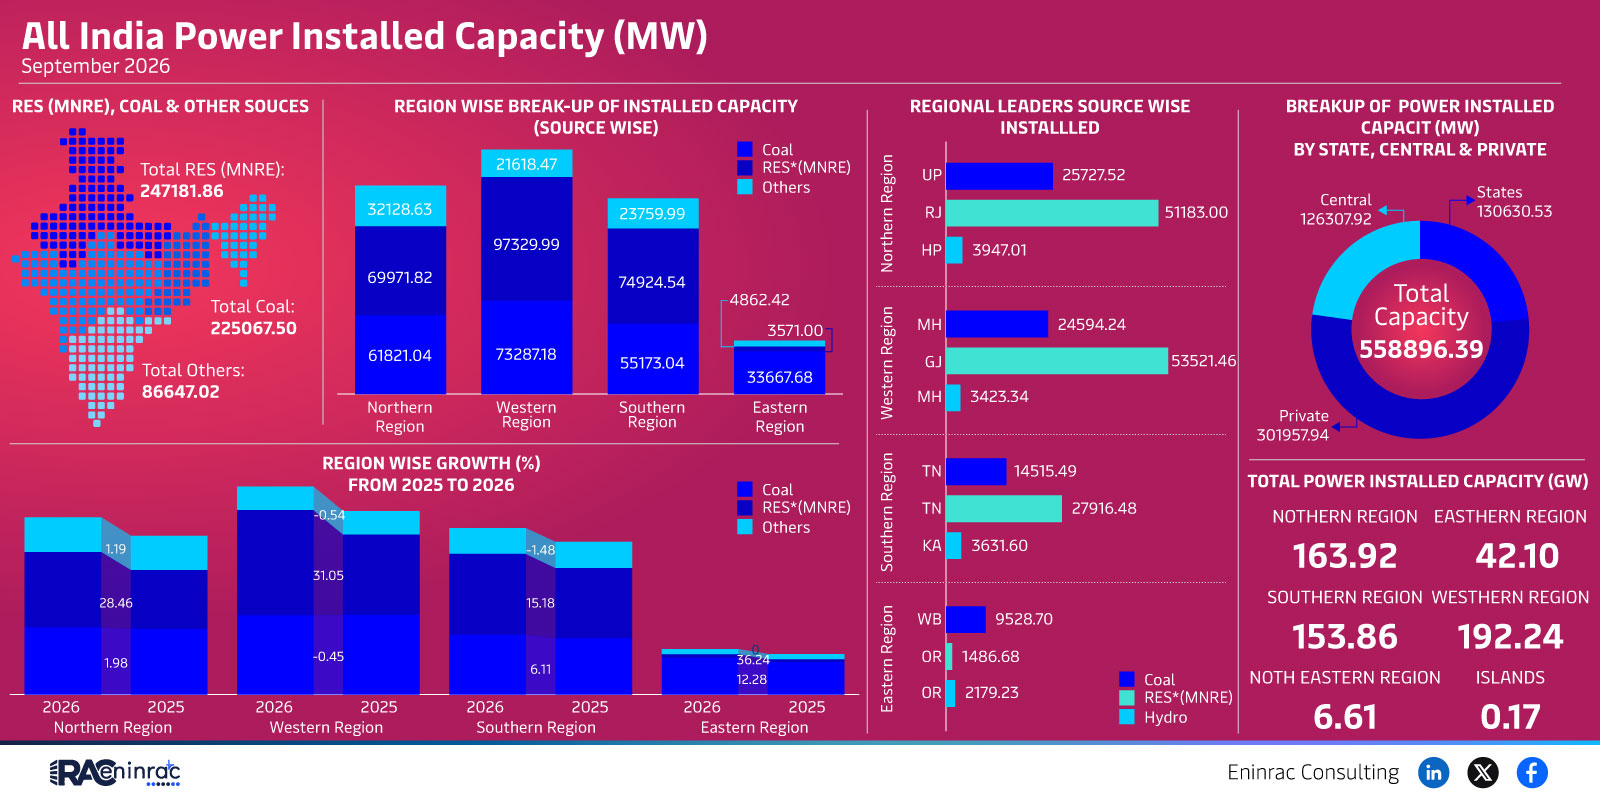
India power installed capacity 2026 presents a comprehensive picture of the nation's energy landscape as of September 2026. The data combines renewable energy sources (RES) managed by MNRE, coal-fired generation, and other sources, providing total installed capacity figures, regional distributions, and state‑wise contributions. Understanding this snapshot is crucial for policymakers, investors, and industry stakeholders who need to gauge the progress of India's transition toward a balanced energy mix, assess regional disparities, and identify growth opportunities across the power sector.
What Does the Data Reveal About This Topic?
The core insight from the raw data is that India's total installed capacity reached approximately 558,896 MW, with renewables accounting for 247,181.86 MW, coal for 225,067.50 MW, and other sources contributing 86,647.02 MW. This indicates that renewables now represent about 44 % of the overall capacity, narrowing the historical dominance of coal. The data also highlights significant regional variations, showing the Western region leading with 192.24 GW and the Northern region close behind at 163.92 GW. The question that follows is: how do these numbers translate into actual trends for the Indian power sector?
Regional and State‑wise Capacity Breakdown
When comparing regions, the Western region tops the list with 192.24 GW, driven by strong private investments and a mix of solar, wind, and thermal plants. The Northern region follows at 163.92 GW, powered largely by coal and emerging renewable projects. Southern and Eastern regions hold 153.86 GW and 42.10 GW respectively, reflecting differing policy focus and resource availability. State‑level data reveals Rajasthan (51,183 MW), Gujarat (53,521.46 MW), Maharashtra (24,594.24 MW), and Himachal Pradesh (3,947.01 MW) as leading contributors. Private sector capacity stands at 301,957.94 MW, underscoring the importance of private participation in meeting the nation's energy goals.
Impact on Sectors and Industries
The shift toward higher renewable capacity influences several sectors. Power generation companies are expanding solar and wind portfolios to meet the growing RES share, while coal producers face pressure to modernize and reduce emissions. Financial markets are adjusting risk assessments, with increased funding flowing into green projects and infrastructure. Policymakers can leverage this data to design incentives that encourage further renewable deployment and address regional imbalances. Consumers benefit from a cleaner energy mix, which can translate into more stable pricing and reduced environmental impact over time.
Key Takeaways
- India's total installed capacity reached roughly 558,896 MW in September 2026.
- Renewables account for about 44 % of the total, marking a significant shift from coal dominance.
- The Western region holds the highest capacity at 192.24 GW, followed by the Northern region.
- Private sector capacity exceeds 300,000 MW, highlighting its critical role in expansion.
- Rajasthan, Gujarat, and Maharashtra are the top three states by installed capacity.
- Growth in renewable capacity is influencing financing, policy, and market dynamics across the energy sector.
FAQs
What is the total installed power capacity in India for 2026?
It is approximately 558,896 MW, combining renewables, coal, and other sources.
How much renewable capacity does India have in 2026?
Renewable sources contribute about 247,182 MW, representing roughly 44 % of the total.
Which region has the highest power capacity?
The Western region leads with 192.24 GW of installed capacity.
What role does the private sector play in India's power capacity?
Private entities account for around 301,958 MW, making up more than half of the renewable and non‑coal capacity.
Which states are the top contributors to power capacity?
Rajasthan, Gujarat, and Maharashtra are the leading states, each exceeding 20,000 MW.