
Introduction
India's renewable energy sector continues to expand rapidly, and the latest monthly data for July 2026 highlights significant contributions across multiple clean sources. Understanding how solar, wind, hydro and biomass installations performed during this period provides valuable insight for policymakers, investors and industry analysts. This article examines the July 2026 generation figures, compares the relative performance of each technology, and explains the broader implications for India's energy transition and climate goals.
What Does the Data Reveal About This Topic?
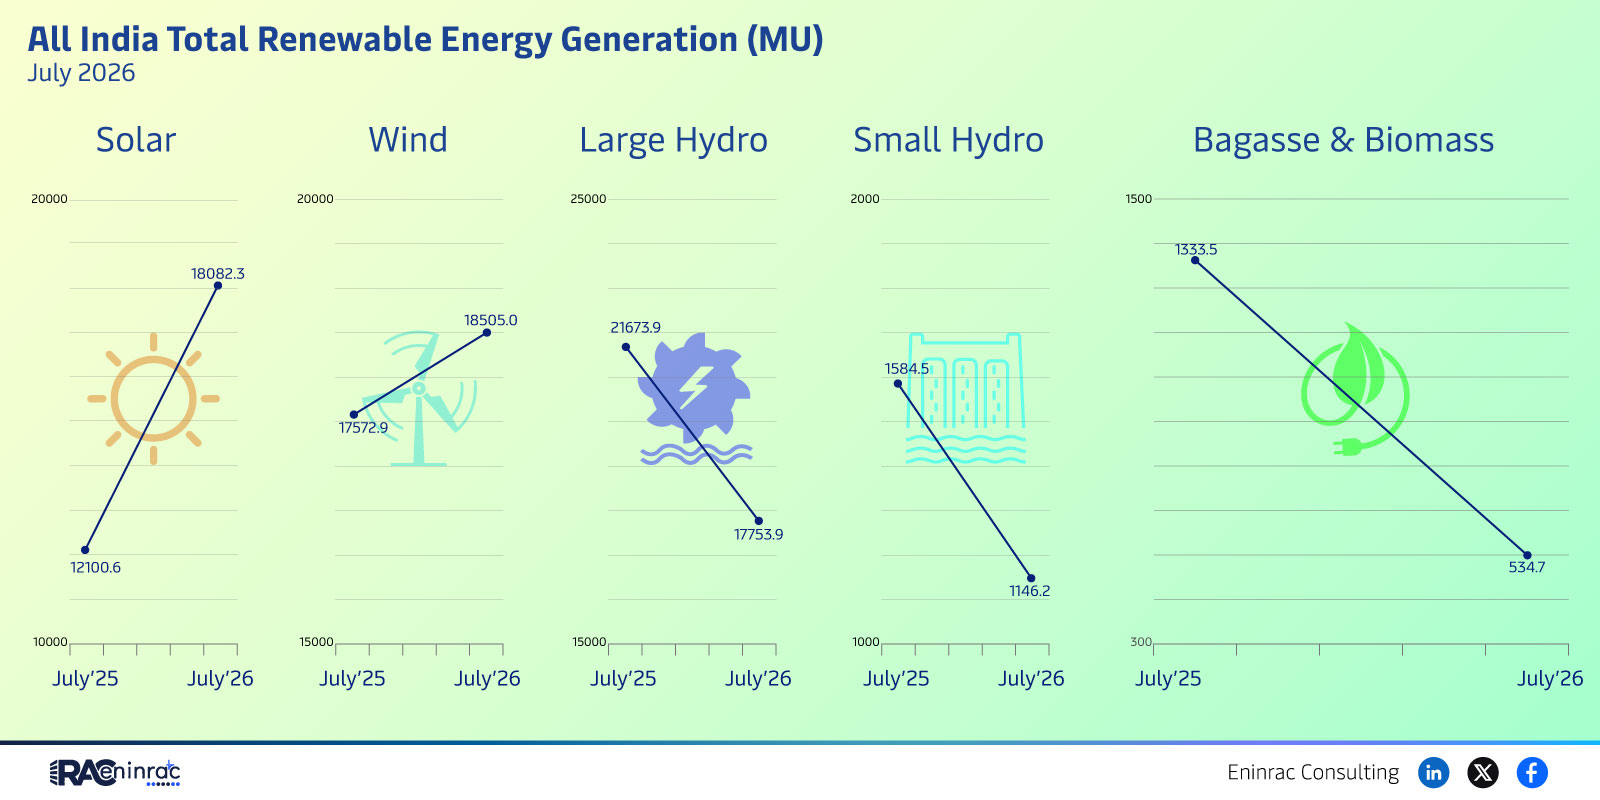
The July 2026 data shows that solar and wind each generated 20,000 million units (MU), large hydro contributed the highest single figure at 25,000 MU, while small hydro and bagasse‑biomass together added 2,000 MU and 1,500 MU respectively. The primary insight is that large hydro remains the dominant source, but solar and wind have achieved parity, indicating a balanced diversification of renewable generation. This balanced mix suggests that India is moving towards a more resilient renewable portfolio.
Solar and Wind Lead Renewable Mix in July 2026
Both solar and wind each delivered 20,000 MU, marking a substantial share of the total renewable output. Their equal performance underscores the effectiveness of recent policy incentives and grid integration efforts that have lowered curtailment and improved capacity utilization. Large hydro, while still the largest single contributor, reflects the legacy of extensive reservoir projects that supply steady base‑load power. In contrast, small hydro and bagasse‑biomass remain modest but important for regional and off‑grid applications, supporting rural electrification and industrial waste‑to‑energy initiatives.
Impact on Sectors and Industries
The July 2026 generation mix influences several key sectors. Power utilities benefit from a diversified supply that reduces dependence on fossil fuels and improves grid stability. Renewable equipment manufacturers see heightened demand for solar panels, wind turbines and hydro turbines, driving domestic supply chains. Financial markets respond with increased investment flows into green bonds and infrastructure funds targeting Indian clean‑energy projects. Policymakers gain credible data to refine subsidy structures and accelerate target‑setting for the 2030 and 2047 climate milestones. Finally, consumers experience lower electricity tariffs as the cost of renewable generation continues to fall.
Key Takeaways
- Large hydro remained the single largest generator with 25,000 MU.
- Solar and wind each produced 20,000 MU, achieving parity.
- Small hydro contributed 2,000 MU, supporting niche regional needs.
- Bagasse and biomass added 1,500 MU, highlighting waste‑to‑energy potential.
- The balanced mix indicates a maturing renewable portfolio across India.
- Strong generation figures bolster confidence in achieving future climate targets.
FAQs
What was the total renewable energy generation in India for July 2026?
The total combined generation from solar, wind, large hydro, small hydro and bagasse‑biomass in July 2026 was 68,500 MU.
Which renewable source contributed the most in July 2026?
Large hydro was the top contributor, delivering 25,000 MU of electricity.
Did solar and wind generation reach similar levels?
Yes, both solar and wind each generated 20,000 MU, indicating equal performance for the month.
How does the July 2026 data affect India’s climate goals?
The strong renewable output supports India’s ambition to increase clean‑energy share, helping to meet its 2030 emissions reduction commitments.
What role does bagasse‑biomass play in the renewable mix?
Bagasse‑biomass contributed 1,500 MU, showcasing the importance of agricultural and industrial waste as a renewable resource.