
Introduction
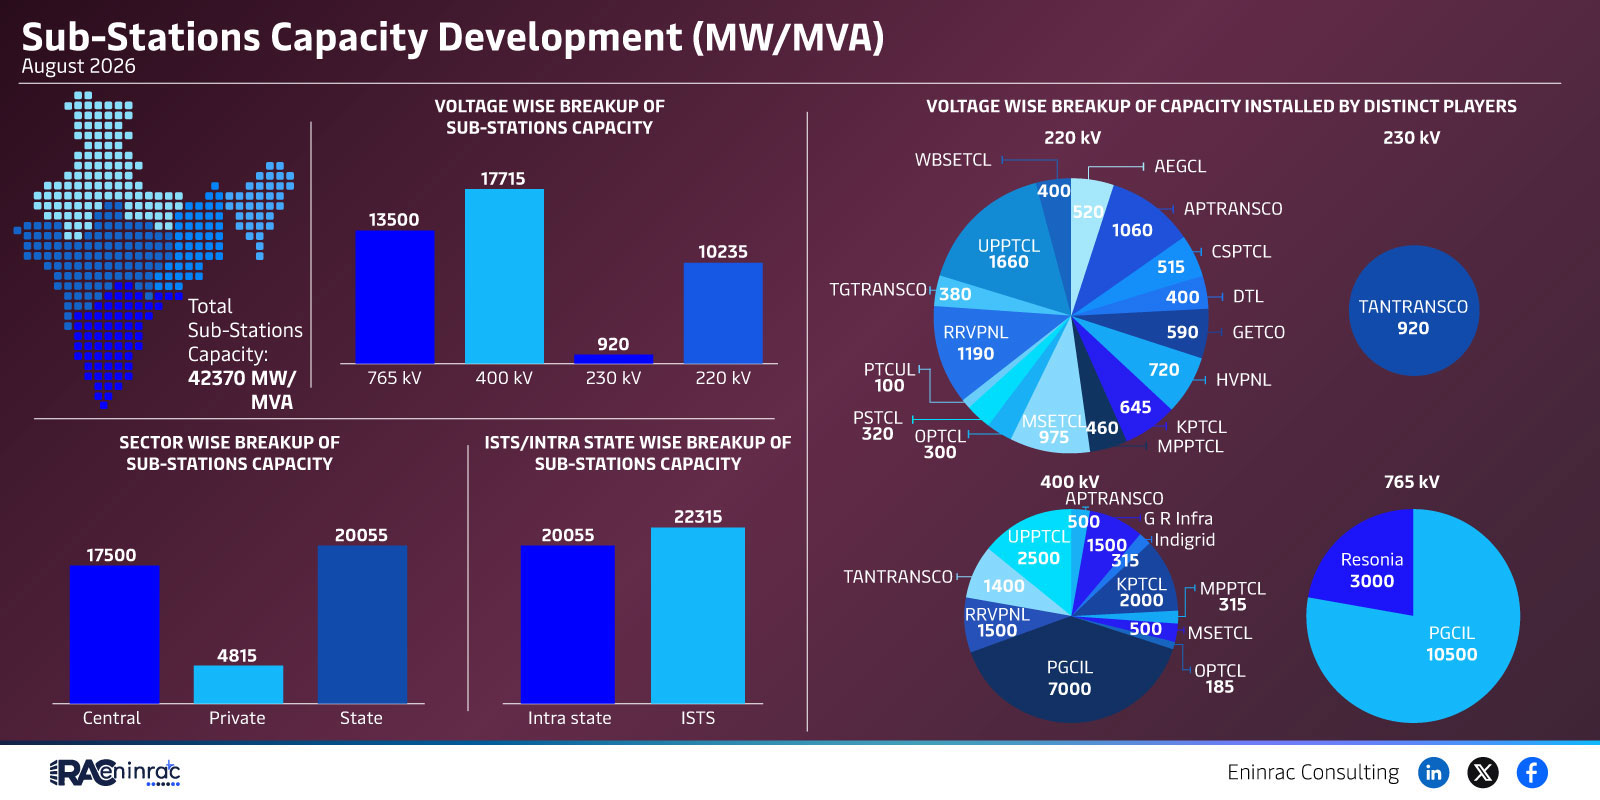
The August 2026 snapshot of sub‑station capacity development in India provides a detailed view of how megawatts are allocated across voltage levels, ownership types and geographic segments. Understanding this distribution is essential for investors, policymakers and energy professionals who monitor the growth of the power transmission network and its ability to meet rising demand.
What Does the Data Reveal About This Topic?
When asked which segment holds the largest share of installed capacity, the data shows that central utilities dominate with 22,315 MW, closely followed by private and state utilities each contributing 20,055 MW. Intra‑state transmission accounts for 17,500 MW while Integrated Solar Transmission Systems (ISTS) represent a smaller yet strategic 4,815 MW. These figures illustrate a balanced but expanding mix of public and private investment.
Voltage‑Wise Capacity Distribution Across Players
At the 220 kV level, the leading participants such as WBSETCL, AEGCL, APTRANSCO and GETCO collectively install roughly 2,675 MW, highlighting the importance of medium‑voltage hubs in regional load balancing. The 400 kV tier features larger corridors operated by entities like PGCIL, OPTCL and MSETCL, delivering capacities that exceed 7,000 MW, thereby enabling long‑distance power transfer. A smaller yet critical 230 kV segment, driven by TANTRANSCO with 920 MW, and the high‑voltage 765 kV corridor managed by Resonia (3,000 MW) show the layered architecture of the grid, where each voltage band supports specific transmission functions.
Impact on Sectors and Industries
These capacity allocations directly affect multiple sectors. Generation companies rely on robust sub‑station networks to evacuate power efficiently, while distribution utilities depend on reliable voltage transformation to serve end‑users. Financial institutions assess the health of the transmission segment when underwriting infrastructure loans, and policymakers use the data to prioritize grid reinforcement projects, especially in high‑growth corridors. Moreover, the presence of private players signals a competitive market that can drive innovation and cost‑effectiveness.
Key Takeaways
- Central utilities hold the largest installed capacity at 22,315 MW, underscoring their pivotal role in grid stability.
- Private and state utilities each contribute over 20,000 MW, reflecting a diversified ownership landscape.
- Intra‑state transmission (17,500 MW) and ISTS (4,815 MW) together support regional power balancing and renewable integration.
- The 220 kV tier remains the workhorse for medium‑range transmission, with multiple players sharing roughly 2,700 MW.
- Higher voltages (400 kV, 230 kV, 765 kV) enable long‑distance bulk power movement, with capacities ranging from 920 MW to 7,000 MW.
- Continued capacity growth across all voltage levels signals ongoing grid expansion to meet future demand.
FAQs
Which ownership type has the highest sub‑station capacity?
Central utilities lead with 22,315 MW, slightly higher than private and state utilities.
What is the role of the 220 kV sub‑stations?
They serve as medium‑voltage hubs that connect regional generation to distribution networks, accounting for a significant share of capacity.
How much capacity is installed at 400 kV?
Collectively, 400 kV players install over 7,000 MW, facilitating long‑distance power transmission.
Why is ISTS capacity important?
ISTS (4,815 MW) supports renewable integration and flexible power routing within the transmission system.
What trends does the 2026 data suggest for future grid development?
The data points to balanced growth across public and private sectors, increased high‑voltage investments and a focus on enhancing intra‑state connectivity.