
Introduction
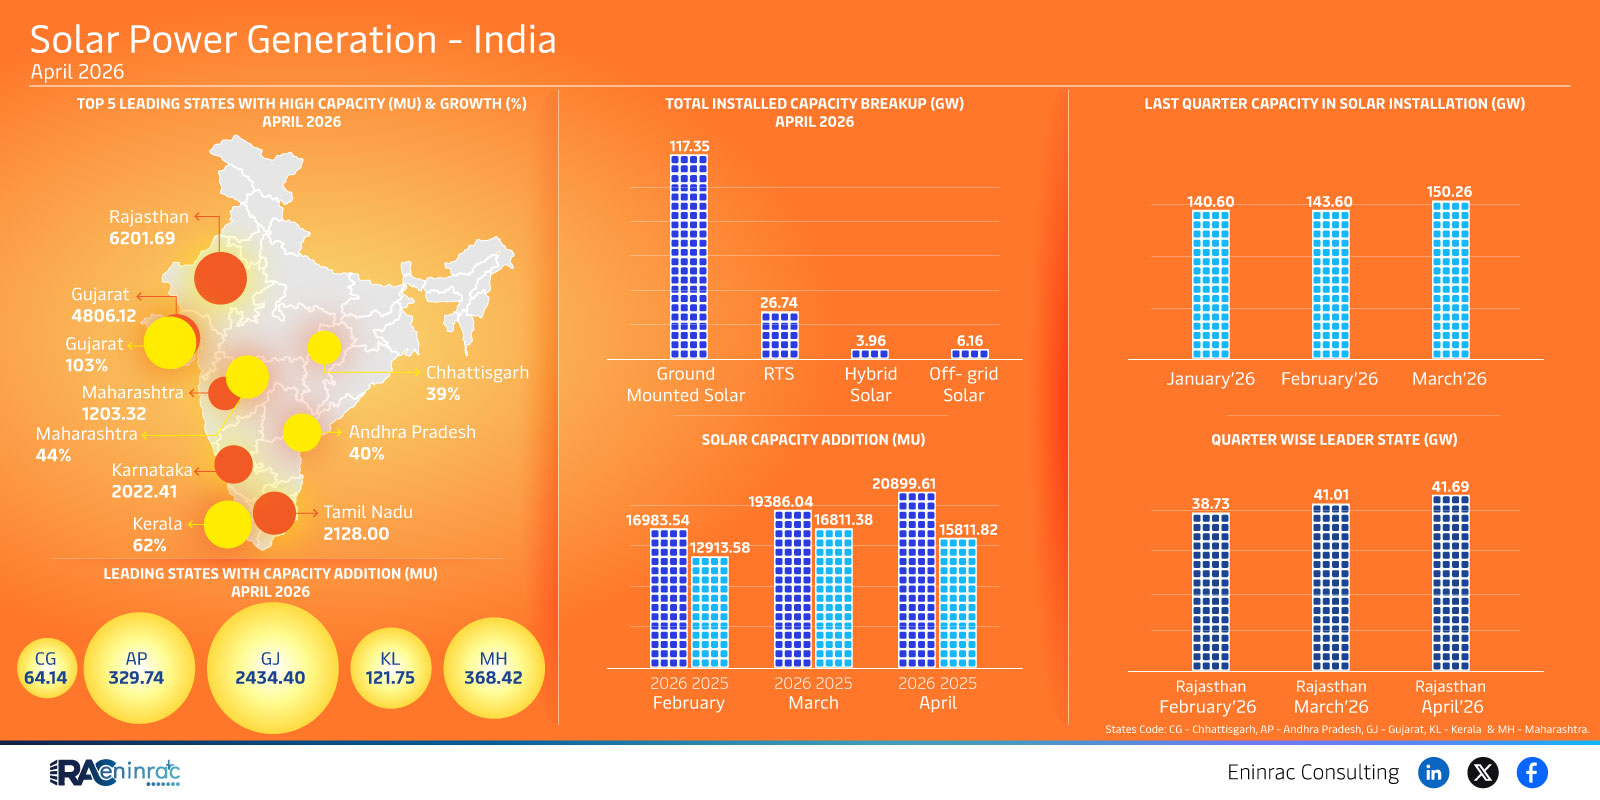
Solar power generation in India reached new milestones in April 2026 with total installed capacity of 117.35 GW and last quarter additions of 26.74 GW. This report examines leading states, capacity breakups, and quarterly trends using official April 2026 data. Readers will learn which states lead solar generation, how capacity is distributed across ground mounted, rooftop, hybrid and off-grid solar, and what the quarterly leader trends mean for the renewable sector.
What Does the Data Reveal About This Topic?
What is the current status of solar power generation in India as of April 2026? The data shows India had 117.35 GW total installed solar capacity with 26.74 GW added in the last quarter. Rajasthan emerged as the consistent quarterly leader with 41.69 GW in February 2026 and 38.73 GW in March 2026, followed by 20899.61 MU capacity addition in April. The breakdown includes ground mounted, rooftop solar, hybrid and off-grid segments showing a diversified mix. Kerala is noted among leading states with capacity addition. This context helps stakeholders track progress toward national renewable targets.
Leading States and Capacity Breakup Trends
The raw data highlights Rajasthan as the top state across February, March and April 2026 with generation of 16983.54 MU, 16811.38 MU and 15811.82 MU respectively. Comparing with other regions, Chhattisgarh, Andhra Pradesh, Gujarat, Kerala and Maharashtra show varied contributions. Total installed capacity breakup of 117.35 GW includes 3.96 GW hybrid and 6.16 GW off-grid solar. Ground mounted and rooftop solar form the majority. The last quarter installation of 26.74 GW reflects accelerating deployment. Kerala's inclusion among leading states with capacity addition indicates growing southern participation in solar power generation India April 2026.
Impact on Sectors and Industries
The expansion of solar power generation impacts utilities, investors, policymakers and consumers. Higher rooftop and hybrid capacity supports distributed generation and grid stability. States like Rajasthan driving volume help lower national carbon intensity. Businesses gain from open access solar and lower tariffs. Policymakers can use quarterly leader data to target incentives. Investors track capacity addition MU to assess manufacturer and developer growth. Consumers benefit from cleaner power and reduced cost over time.
Key Takeaways
- India total installed solar capacity stood at 117.35 GW in April 2026.
- Last quarter solar installation reached 26.74 GW across all segments.
- Rajasthan led quarterly solar generation in February, March and April 2026.
- Capacity breakup includes 3.96 GW hybrid and 6.16 GW off-grid solar.
- Kerala is among leading states with notable solar capacity addition.
- April 2026 saw 20899.61 MU solar capacity addition led by Rajasthan.
FAQs
What is India's total solar capacity in April 2026?
India had 117.35 GW total installed solar capacity with 26.74 GW added in the last quarter per April 2026 data.
Which state leads solar generation in April 2026?
Rajasthan is the leading state with the highest quarterly capacity and 20899.61 MU addition in April 2026.
What are the solar capacity segments in India?
Segments include ground mounted, rooftop, hybrid at 3.96 GW and off-grid at 6.16 GW as of April 2026.
How much solar was added last quarter?
Last quarter installation was 26.74 GW reflecting strong growth in solar power generation India April 2026.
Is Kerala a leading solar state?
Yes, Kerala is listed among leading states with capacity addition showing southern regional growth.