
Introduction
The South India energy power requirement for June 2026 provides a critical snapshot of electricity demand across five key states. Understanding this data helps policymakers, investors, and industry stakeholders gauge regional consumption patterns, assess supply adequacy, and plan future infrastructure. This overview explains the numbers, highlights state‑wise differences, and explores the implications for the power sector in South India. Readers will learn which states lead in demand, how total supply compares to total requirement, and what trends may influence upcoming energy strategies.
What Does the Data Reveal About This Topic?
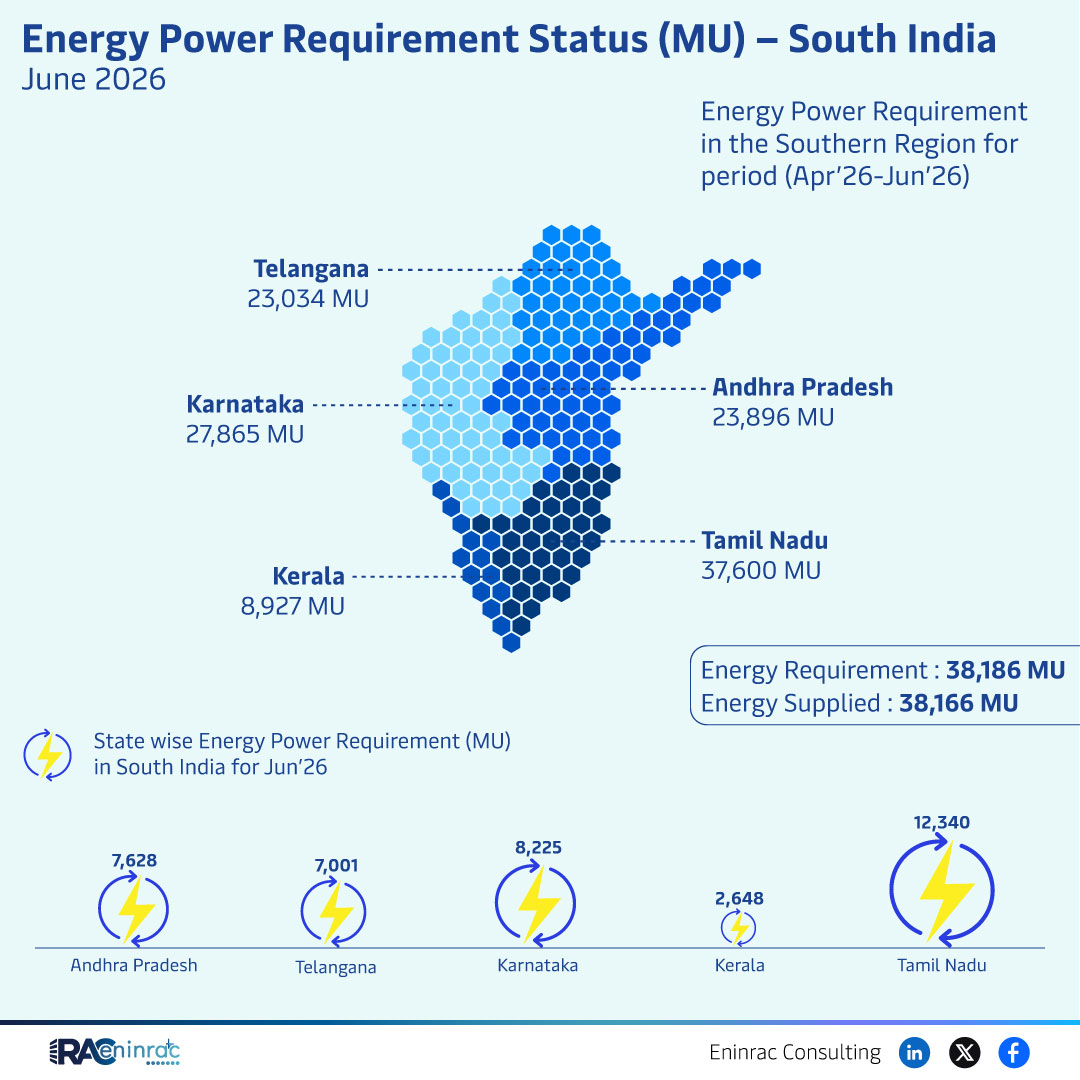
The raw figures show that the combined energy requirement for the Southern Region in the April‑June 2026 period totals 38,186 MU, while the energy supplied amounts to 38,166 MU, indicating a marginal shortfall of 20 MU. Telangana reports 23,034 MU, Andhra Pradesh 23,896 MU, Karnataka 8,927 MU, Kerala 12,340 MU, and Tamil Nadu the highest demand at 37,600 MU. The data answers the core question: are Southern states meeting their power needs, and where do gaps appear?
State‑wise Power Requirement Comparison for June 2026
Comparing the states reveals notable disparities. Tamil Nadu dominates the requirement chart with 37,600 MU, far exceeding the next highest—Andhra Pradesh at 23,896 MU. Telangana follows closely with 23,034 MU. Karnataka’s demand is modest at 8,927 MU, while Kerala records 12,340 MU. The aggregate supply of 38,166 MU nearly matches the total requirement, yet the slight deficit underscores the need for precise balancing, especially in high‑demand states. These trends suggest targeted capacity additions may be required in Tamil Nadu and Andhra Pradesh to eliminate future shortfalls.
Impact on Sectors and Industries
Energy demand fluctuations directly affect generation companies, transmission operators, and distribution networks. A near‑balanced supply‑demand scenario supports industrial productivity, but even a 20 MU shortfall can strain high‑load sectors such as manufacturing and IT services in Tamil Nadu. Investors monitor these metrics to allocate capital toward new generation assets or grid upgrades. Policymakers use the state‑wise breakdown to prioritize subsidies, renewable integration, and demand‑side management programs, ensuring reliable power delivery across the Southern region.
Key Takeaways
- Tamil Nadu leads with the highest June 2026 demand.
- Total supply is only 20 MU below total requirement.
- Kerala and Karnataka show lower consumption levels.
- Minor shortfall highlights need for precise capacity planning.
- State‑wise data aids targeted policy interventions.
- Investors can identify regions with growth potential.
FAQs
What was the total power requirement for South India in June 2026?
The total requirement was 38,186 MU across the five states.
Which state had the greatest power demand?
Tamil Nadu recorded the highest demand at 37,600 MU.
Did the region meet its power demand?
Supply was 38,166 MU, leaving a small shortfall of 20 MU.
How does Karnataka’s demand compare to other states?
Karnataka’s demand of 8,927 MU is lower than Telangana, Andhra Pradesh, Kerala, and Tamil Nadu.
Why is state‑wise data important for energy planning?
It helps allocate resources, plan new generation, and address regional supply gaps effectively.