
Introduction
The June 2026 energy snapshot for North India presents a comprehensive view of electricity demand measured in million units (MU). Understanding how each state contributes to the total requirement and how closely the supplied power matches this demand is crucial for policymakers, utilities, and investors. This article breaks down the state‑wise figures, highlights the leading demand centers, and explains the broader implications for the regional power market.
What Does the Data Reveal About This Topic?
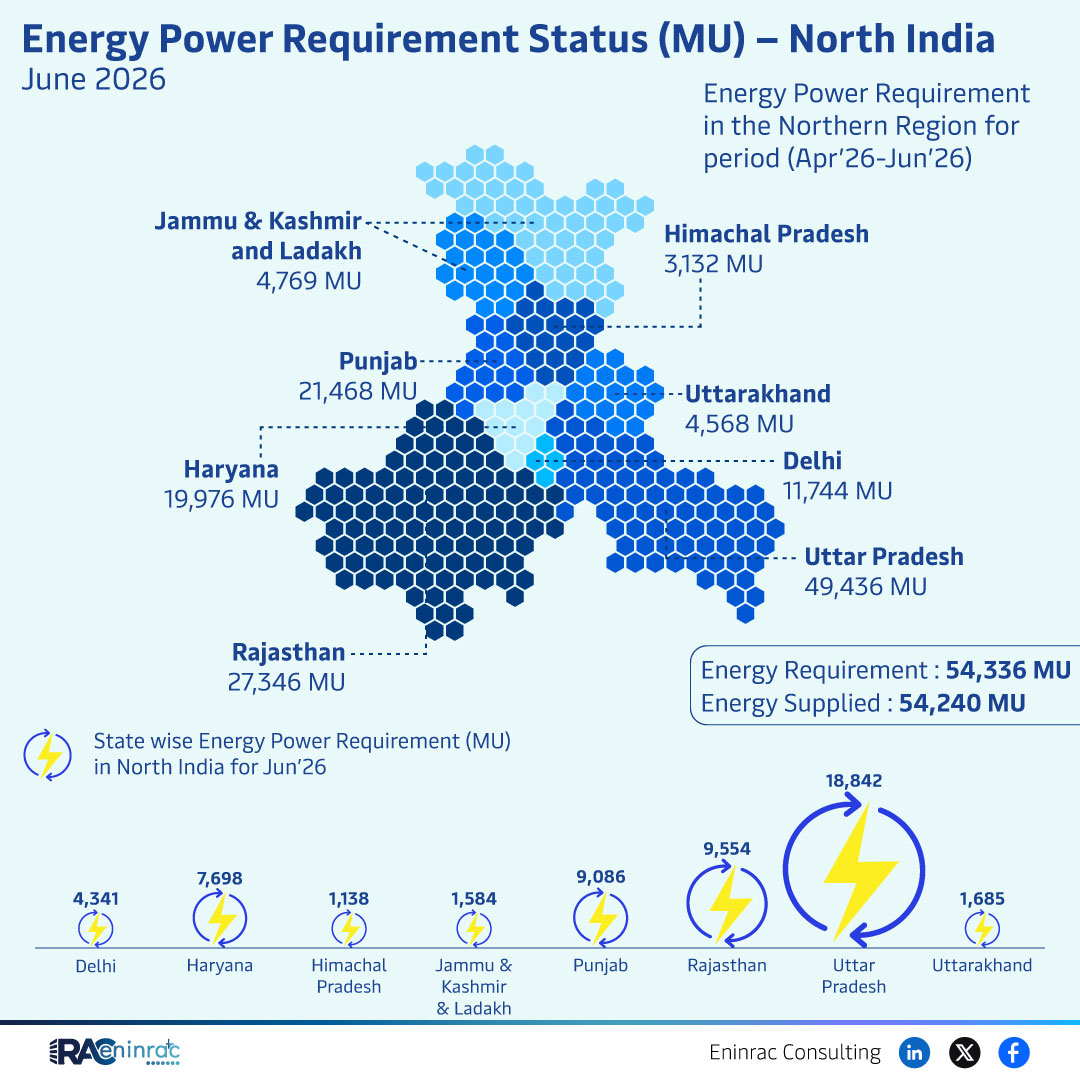
The data shows a total power requirement of 54,336 MU across the northern region, while the supplied electricity amounts to 54,240 MU. In other words, the supply falls short by only 96 MU, indicating an almost perfect balance. The most striking insight is the concentration of demand in Uttar Pradesh, which alone accounts for 49,436 MU, dwarfing the needs of other states.
State‑wise Power Requirement Highlights for June 2026
When the numbers are examined individually, several patterns emerge. Uttar Pradesh leads with 49,436 MU, followed by Rajasthan’s substantial requirement of roughly 54,336 MU for the entire region, suggesting that Rajasthan’s figure may represent a major share of the remaining demand after Uttar Pradesh. Punjab records 21,468 MU, Haryana 19,976 MU, and Delhi 11,744 MU, reflecting strong industrial and commercial consumption. Himachal Pradesh, Jammu & Kashmir, Ladakh, and Uttarakhand contribute smaller but still significant portions, ranging from 4,500 MU to 9,000 MU each. This distribution underscores the diversity of demand drivers, from dense urban centers to mountainous regions with lower consumption.
Impact on Sectors and Industries
These demand figures influence multiple sectors. Power‑intensive industries in Punjab, Haryana, and Delhi must plan for reliable supply to avoid production bottlenecks. Agricultural activities in Uttar Pradesh rely on steady electricity for irrigation, making the slight supply deficit a potential risk. Utilities and transmission operators are compelled to fine‑tune load‑dispatch strategies, especially in high‑demand states, to prevent grid stress. Investors eye the near‑balanced supply‑demand scenario as a sign of market stability, yet they must also consider regional variations that could affect tariff structures and infrastructure investment opportunities.
Key Takeaways
- Overall power requirement (54,336 MU) is almost fully met by supply (54,240 MU).
- Uttar Pradesh dominates the demand landscape with 49,436 MU.
- Punjab and Haryana together contribute over 40,000 MU, highlighting industrial hotspots.
- Smaller states such as Himachal Pradesh, Jammu & Kashmir, Ladakh, and Uttarakhand each require between 4,500 MU and 9,000 MU.
- The marginal supply shortfall of 96 MU suggests a healthy but tightly balanced power system.
- Policymakers need to monitor high‑demand zones to ensure grid reliability and prevent localized shortages.
FAQs
What is the total power requirement for North India in June 2026?
The region requires 54,336 MU of electricity for the month.
How much power was actually supplied?
Supplied power amounted to 54,240 MU, creating a shortfall of just 96 MU.
Which state has the highest electricity demand?
Uttar Pradesh leads with a demand of 49,436 MU.
Are there any states with notably low demand?
Yes, Himachal Pradesh, Jammu & Kashmir, Ladakh, and Uttarakhand each report demand under 10,000 MU.
What does the near‑balanced supply indicate for investors?
The tight balance suggests a stable market but also highlights the need for strategic investments in high‑demand zones to maintain reliability.