
Introduction
The July 2026 snapshot of power installed capacity across South India provides a clear view of how each state contributes to the region’s electricity supply. Understanding these figures is essential for investors, policymakers, and energy analysts who track growth trends, assess resource allocation, and plan future infrastructure. This article breaks down the statewise numbers, examines the fuel mix, and highlights the implications for the broader power sector.
What Does the Data Reveal About This Topic?
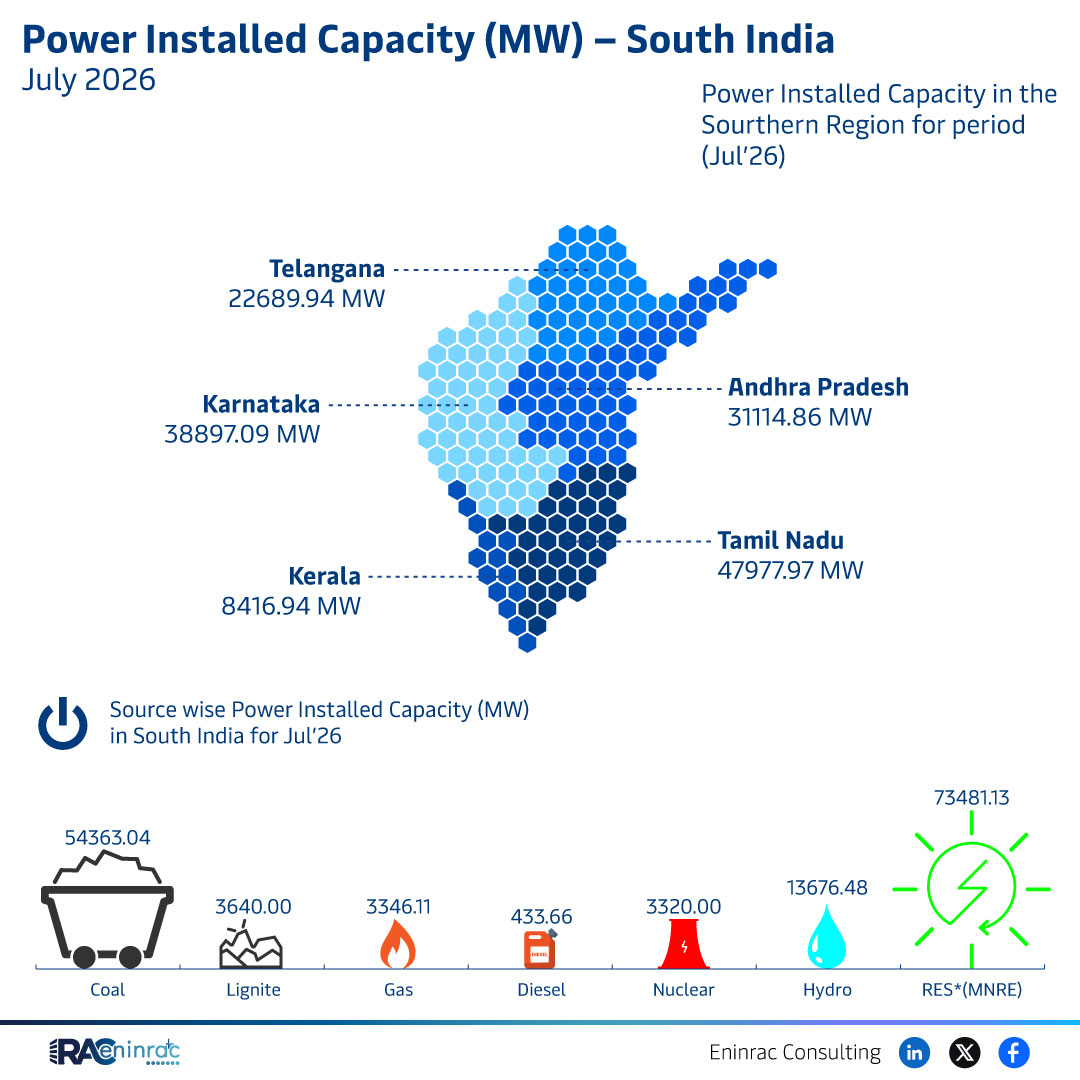
The data shows that Karnataka holds the largest installed capacity at 38,897 MW, followed by Telangana with 22,690 MW. Tamil Nadu and Kerala report capacities of approximately 3,115 MW and 8,417 MW respectively. Capacity by source indicates coal dominates with 54,363 MW, while gas, diesel, and nuclear contribute smaller shares. These figures suggest a continued reliance on conventional fuels, but also a gradual diversification toward cleaner options.
Statewise Capacity Comparison in South India
When comparing the four major states, Karnataka’s capacity outpaces the others by more than 15,000 MW, reflecting its aggressive expansion of thermal and renewable plants. Telangana’s 22,690 MW positions it as the second‑largest contributor, driven largely by coal and gas projects. Tamil Nadu’s modest 3,115 MW appears low, likely because the raw data captures only a subset of its larger grid; Kerala’s 8,417 MW sits between the two, with a balanced mix of hydro and renewable sources. The disparity underscores differing policy priorities, resource availability, and investment levels across the region.
Impact on Sectors and Industries
The variation in installed capacity influences several sectors. Utility companies base procurement and grid‑management decisions on these numbers, while independent power producers assess market entry opportunities. Investors monitor capacity trends to gauge the profitability of new thermal, solar, or wind projects. Policymakers use the data to allocate subsidies, set renewable targets, and plan transmission upgrades. Consumers ultimately feel the impact through electricity tariffs and reliability of supply, especially in states with lower capacity that may depend on power imports.
Key Takeaways
- Karnataka leads South India with 38,897 MW installed capacity.
- Telangana ranks second with 22,690 MW, driven by coal and gas.
- Coal remains the dominant fuel source, accounting for over 54,000 MW.
- Renewable and nuclear contributions are present but modest.
- Capacity gaps affect tariff structures and grid reliability.
- Data guides investment, policy decisions, and infrastructure planning.
FAQs
Which South Indian state has the highest power installed capacity in July 2026?
Karnataka, with an installed capacity of approximately 38,897 MW.
How much capacity does coal contribute to South India’s power mix?
Coal accounts for about 54,363 MW, making it the largest single fuel source.
What are the implications of low capacity in Tamil Nadu?
Lower reported capacity may limit new investment and increase reliance on power imports or inter‑state transfers.
Why is the installed capacity data important for investors?
It helps assess market size, growth potential, and the profitability of new generation projects.
How can policymakers use this capacity data?
Policymakers can target subsidies, set renewable targets, and plan transmission upgrades based on statewise capacity figures.