
Introduction
The July 2026 snapshot of North India power installed capacity provides a clear picture of how each state contributes to the region’s electricity landscape. Understanding these figures is essential for policymakers, investors, and energy analysts who track growth, plan infrastructure, and assess the shift toward cleaner sources. This article breaks down statewise capacity, highlights key energy mixes, and outlines the implications for various sectors.
What Does the Data Reveal About This Topic?
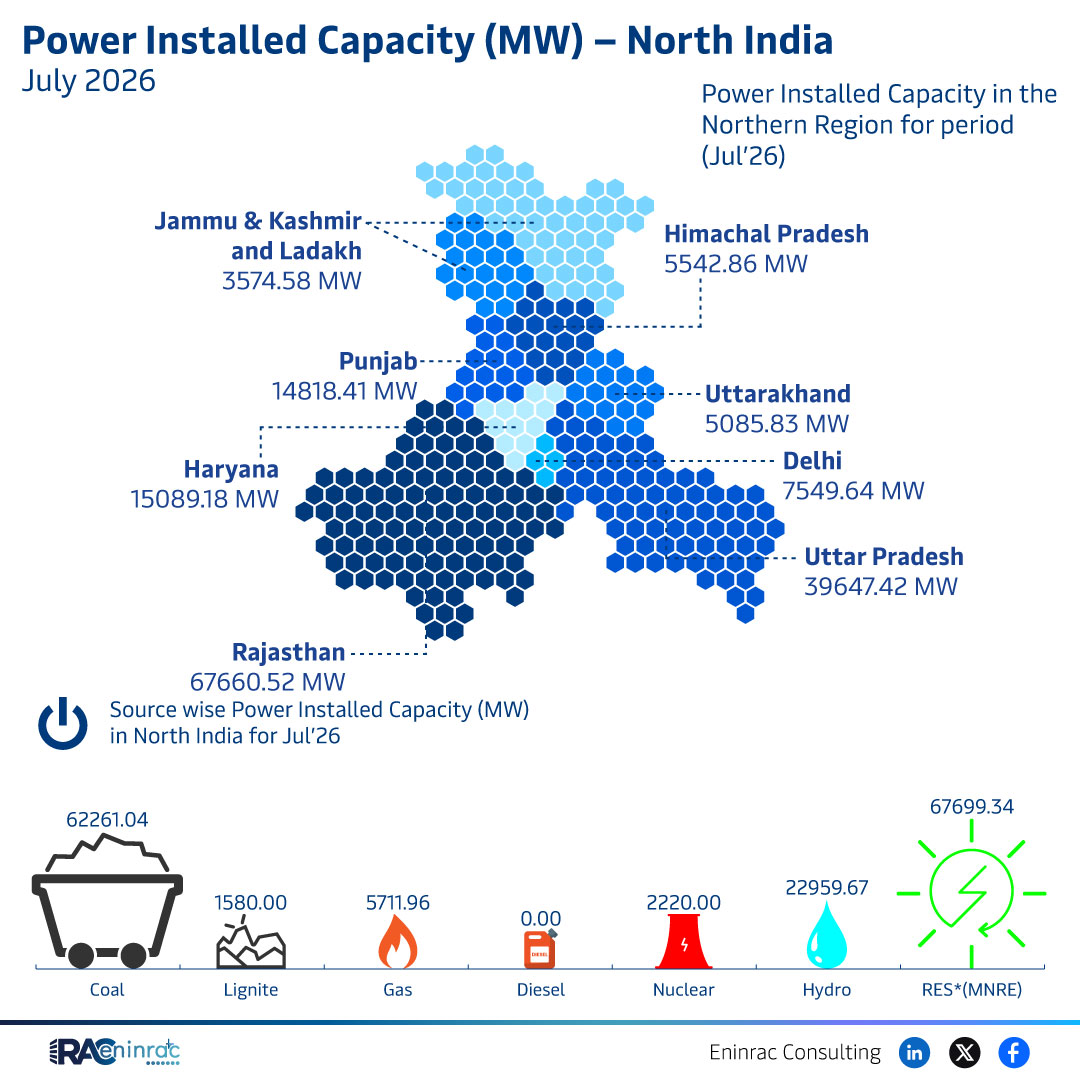
What does the latest data tell us about North India power installed capacity? The numbers show Rajasthan leading with over 67,000 MW, followed by Uttar Pradesh at roughly 39,600 MW and Punjab nearing 15,000 MW. Smaller states like Jammu & Kashmir, Himachal Pradesh and Ladakh collectively hold about 3,600 MW, while Haryana’s reported figure approaches 15,089 MW. The mix of coal, gas, hydro and renewable sources indicates a diversified but still fossil‑dominant portfolio.
Statewise Capacity Comparison for July 2026
Comparing the states reveals stark contrasts. Rajasthan’s 67,660 MW outpaces all others, driven by a combination of thermal and renewable projects. Uttar Pradesh, with 39,647 MW, benefits from extensive coal plants and emerging solar farms. Punjab’s 14,818 MW reflects its agricultural and industrial demand. Smaller jurisdictions such as Uttarakhand (5,086 MW) and Delhi (7,550 MW) show modest capacities, yet their share of renewable hydro and solar is proportionally higher. The data also notes a total North India source‑wise capacity of 67,699 MW, split among coal, lignite, gas, diesel, nuclear, hydro and other renewables.
Impact on Sectors and Industries
The distribution of installed capacity influences multiple sectors. Energy‑intensive industries in high‑capacity states gain reliability and lower procurement costs, encouraging manufacturing growth. Renewable‑rich regions attract green investment, boosting local employment in solar and wind sectors. Policymakers can use these insights to prioritize grid upgrades, transmission reinforcement, and demand‑side management. Investors looking at the Indian power market can identify lucrative opportunities in states where capacity is expanding but transmission bottlenecks persist.
Key Takeaways
- Rajasthan leads North India with over 67,000 MW installed capacity.
- Uttar Pradesh ranks second, highlighting continued reliance on coal.
- Punjab’s capacity reflects strong agricultural and industrial demand.
- Smaller states contribute modest MW but show higher renewable percentages.
- Total regional capacity sits at roughly 67,700 MW across all sources.
- Sectoral impacts include industrial growth, renewable investment, and grid planning needs.
FAQs
Which North Indian state has the highest installed capacity?
Rajasthan, with about 67,660 MW, holds the top position for July 2026.
How much renewable capacity is included in the total?
The data groups hydro, solar and other renewables, accounting for a notable share but still less than fossil‑fuel sources.
What is the role of coal in North India’s power mix?
Coal remains dominant, especially in Uttar Pradesh and Rajasthan, providing the bulk of base‑load generation.
Are there any states focusing on nuclear power?
The provided figures list a small nuclear component within the overall regional mix, but no state‑specific breakdown is given.
How can investors use this capacity data?
Investors can pinpoint high‑growth states, assess transmission gaps, and target renewable projects where policy support is strongest.