
Introduction
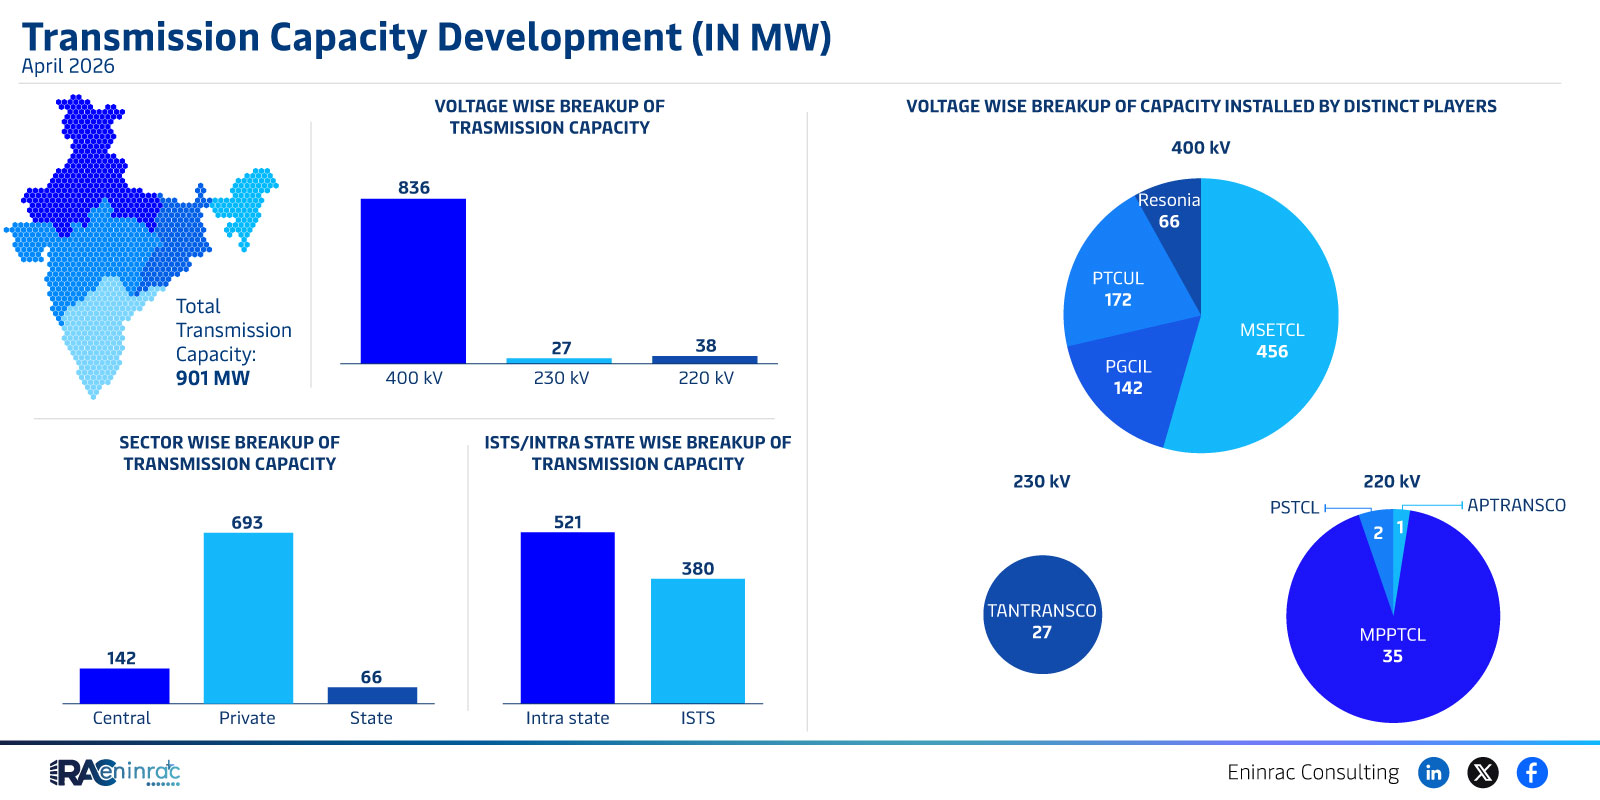
The April 2026 transmission capacity development report provides a concise snapshot of India's electricity grid expansion measured in megawatts. It outlines the total transmission capacity, distinguishes between private and state ownership, and details the voltage‑wise distribution across major transmission players. Understanding these figures is essential for grid planners, investors, and policymakers who need to assess infrastructure readiness and future investment opportunities.
What Does the Data Reveal About This Topic?
What insights can be drawn from the April 2026 numbers? The data shows a total installed transmission capacity of approximately 693 MW, with a significant share allocated to private entities and a notable portion managed by state utilities. The voltage‑wise breakdown highlights the dominance of 400 kV lines installed by MSETCL, while 230 kV and 220 kV corridors are primarily operated by APTRANSCO and TANTRANSCO. This split indicates a balanced approach to high‑voltage backbone development and regional distribution support.
Voltage‑Wise Capacity Distribution by Player and Voltage Level
A comparative look at the voltage tiers reveals that 400 kV infrastructure accounts for roughly 456 MW, representing the largest single‑voltage segment and underscoring MSETCL's leading role in high‑capacity corridors. The 230 kV and 220 kV segments together contribute an additional 237 MW, primarily under the stewardship of APTRANSCO and TANTRANSCO. Private sector contributions are concentrated in the higher voltage range, reflecting strategic investments where bulk power transfer efficiency is critical. State‑run transmission continues to support lower voltage networks that feed into regional distribution systems.
Impact on Sectors and Industries
The ongoing transmission capacity development influences multiple sectors. For renewable energy developers, expanded high‑voltage lines facilitate the integration of large solar and wind farms by reducing congestion and transmission losses. Industrial consumers benefit from more reliable power delivery, which can lower operating costs and improve competitiveness. Financial investors gain clearer risk assessments as the data illustrates concrete capacity additions and ownership structures, guiding capital allocation toward projects with strong policy backing. Policymakers can use the breakdown to prioritize future upgrades, ensuring that supply aligns with projected demand growth across both private and public corridors.
Key Takeaways
- Total transmission capacity reached 693 MW in April 2026, marking steady growth.
- Private sector holds a substantial portion of high‑voltage 400 kV infrastructure.
- State utilities dominate the 230 kV and 220 kV segments, supporting regional distribution.
- MSETCL contributed 456 MW at 400 kV, leading high‑capacity development.
- APTRANSCO and TANTRANSCO together provide 237 MW across 230 kV and 220 kV lines.
- Enhanced transmission capacity underpins renewable integration, industrial reliability, and investment confidence.
FAQs
What is the total transmission capacity reported for April 2026?
The report lists a total installed transmission capacity of about 693 MW.
Which voltage level has the highest capacity?
400 kV lines hold the largest capacity, accounting for roughly 456 MW.
How is the capacity divided between private and state owners?
Private entities dominate the 400 kV segment, while state utilities manage most of the 230 kV and 220 kV capacity.
Why does voltage‑wise breakdown matter for investors?
Understanding voltage distribution helps investors assess risk, project profitability, and alignment with policy goals for grid modernization.
What impact does this development have on renewable energy integration?
Increased high‑voltage capacity reduces transmission bottlenecks, enabling smoother integration of large‑scale solar and wind projects into the grid.