
Introduction
The month of August 2026 saw a notable surge in renewable energy generation across India's Inter‑State Generating Stations (ISGS). Measured in million units (MU), the data captures contributions from solar, wind, private and central sectors, and highlights the leading states and companies driving the growth. Understanding this snapshot is essential for policymakers, investors, and industry analysts who track India's transition to clean power. In this article we break down the regional distribution, examine the top five ISGS players, compare solar‑wind shares, and discuss the broader implications for the energy market. Readers will gain a clear picture of where renewable output is strongest and which trends are shaping the sector.
What Does the Data Reveal About This Topic?
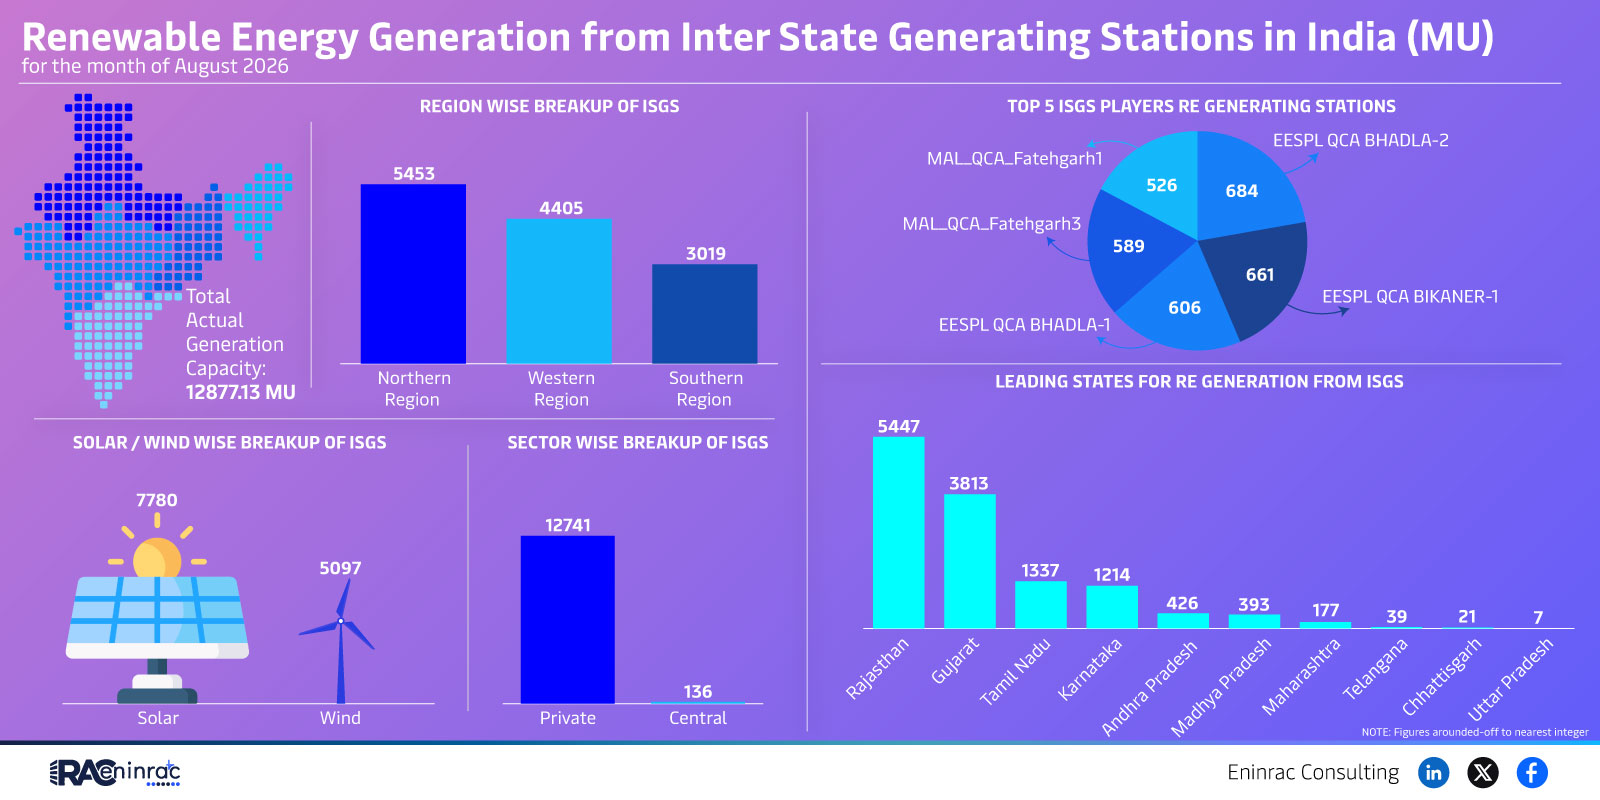
What does the August 2026 ISGS data tell us about renewable generation in India? It reveals a total generation of 13,371,214 MU, with solar contributing 7,780 MU and wind 5,097 MU. Private entities generated 136 MU, while central utilities accounted for the remaining share. The leading states—North, West, and South—collectively produced the bulk of the output, underscoring regional imbalances. Moreover, the top five ISGS players—EESPL QCA Bhadla‑2, MAL_QCA_Fatehgarh1, MAL_QCA_Fatehgarh3, EESPL QCA Bikaner‑1, and another solar‑wind station—dominate the landscape, reflecting the importance of large‑scale projects in meeting national targets.
Regional Performance and Leading Generating Stations
The regional breakdown shows the North, West and South zones supplying the lion's share of renewable MU, while the East and Central lag behind. Among the top generators, EESPL QCA Bhadla‑2 leads with the highest output, followed closely by MAL_QCA_Fatehgarh1 and MAL_QCA_Fatehgarh3, both wind‑rich sites. EESPL QCA Bikaner‑1 rounds out the top four, highlighting the dominance of large solar‑wind hybrid stations in high‑irradiance states such as Rajasthan and Gujarat. This concentration suggests that future policy incentives should encourage diversification into under‑represented regions to balance grid stability and promote equitable growth across the country.
Impact on Sectors and Industries
Renewable generation through ISGS directly influences the power sector’s supply mix, reducing reliance on coal and lowering emissions. Investors see heightened confidence as large‑scale solar‑wind projects demonstrate commercial viability, prompting further capital inflow into green assets. Policymakers can leverage the data to refine subsidy structures and transmission planning, especially in high‑output zones. The private sector’s modest 136 MU contribution signals room for expansion, while central utilities must coordinate grid integration to handle variable output. Overall, the August 2026 figures reinforce the accelerating shift toward sustainable energy across India’s industrial, commercial and residential markets.
Key Takeaways
- India’s ISGS produced over 13 million units of renewable energy in August 2026.
- Solar contributed 7 780 MU while wind added 5 097 MU.
- North, West and South regions dominate renewable generation.
- EESPL QCA Bhadla‑2 is the top‑producing ISGS station.
- Private sector generated a modest 136 MU, highlighting growth potential.
- Data supports policy focus on regional diversification and grid integration.
FAQs
What is the total renewable generation from ISGS in August 2026?
The ISGS network generated 13,371,214 million units of renewable energy during August 2026.
Which renewable source contributed the most MU?
Solar power was the largest contributor, delivering 7,780 MU, followed by wind at 5,097 MU.
Who are the leading ISGS players?
The top five stations are EESPL QCA Bhadla‑2, MAL_QCA_Fatehgarh1, MAL_QCA_Fatehgarh3, EESPL QCA Bikaner‑1, and another major solar‑wind hybrid facility.
How do regional outputs differ across India?
North, West and South zones supply the majority of renewable MU, while the East and Central regions produce comparatively less output.
Why is the private sector contribution important?
Although modest at 136 MU, private sector generation indicates untapped potential and encourages greater private investment in renewable projects.