
Introduction
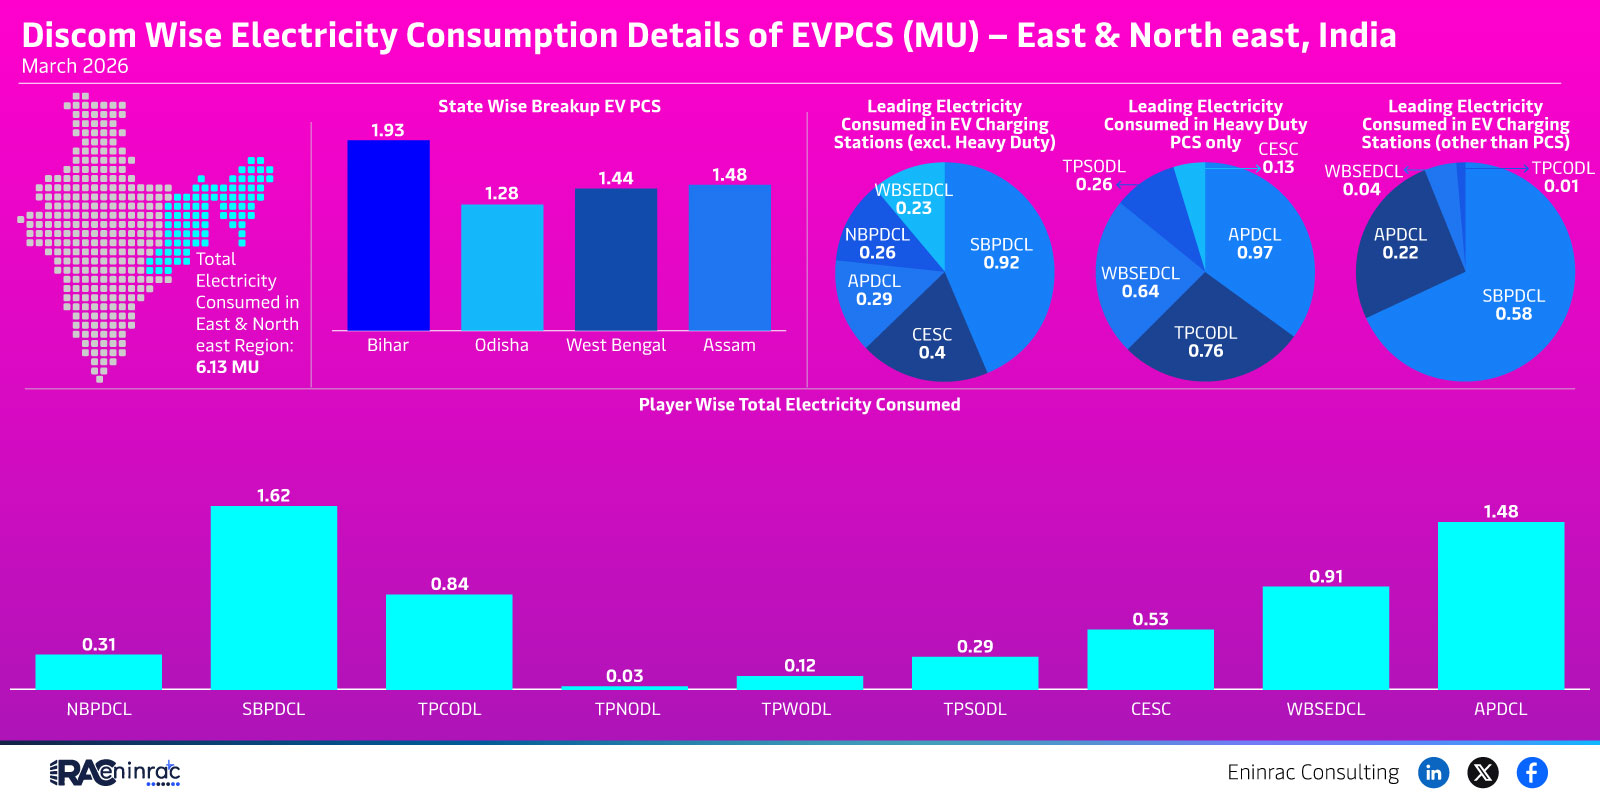
The recent release of performance figures for two major Indian power distribution companies, SBPDCL and TPCODL, has attracted attention from investors, policymakers, and energy consultants. SBPDCL recorded a metric of 0.58 while TPCODL posted 0.76, suggesting differing levels of operational efficiency and service quality. This article, prepared by Eninrac Consulting, breaks down what these numbers mean, compares the two utilities, and explains the broader impact on the state electricity sector. Readers will learn how to interpret the data, identify trends, and apply the insights to strategic decisions.
What Does the Data Reveal About This Topic?
The key insight from the raw data is that TPCODL’s performance index of 0.76 exceeds SBPDCL’s 0.58, indicating a higher relative efficiency or reliability score. Does a higher number always translate to better service? In the context of Indian distribution metrics, the value typically reflects a composite of loss reduction, revenue collection, and outage management. Therefore, TPCODL appears to be delivering a more robust distribution network compared with SBPDCL, though regional challenges and consumer demographics also play a role.
Comparative Analysis of SBPDCL and TPCODL Metrics
When we place the two figures side by side, the gap of 0.18 points represents a measurable difference in operational performance. SBPDCL, serving predominantly rural and semi‑urban areas, often grapples with older infrastructure and lower revenue per consumer, which can depress its index. TPCODL, on the other hand, benefits from recent investments in smart grid technology and a larger commercial customer base that supports higher collection efficiency. The contrast highlights how capital allocation, asset modernisation, and customer mix drive the divergent scores.
Impact on Sectors and Industries
The variation in distribution performance influences several downstream sectors. A higher efficiency score like TPCODL’s can lower average transmission and distribution losses, reducing overall electricity costs for industrial users and encouraging manufacturing investment. Conversely, lower scores at SBPDCL may signal higher tariffs or more frequent outages, affecting agricultural productivity and small‑scale enterprises in its coverage area. Policymakers can use these metrics to prioritise funding for grid upgrades, while investors may view TPCODL as a lower‑risk asset in the power utilities segment.
Key Takeaways
- TPCODL outperforms SBPDCL with a 0.76 index versus 0.58.
- The gap reflects differences in infrastructure investment and customer composition.
- Higher performance correlates with reduced losses and lower consumer tariffs.
- SBPDCL’s lower score indicates potential areas for grid modernisation.
- Eninrac Consulting recommends targeted capital infusion for SBPDCL to bridge the efficiency gap.
- Stakeholders should monitor these metrics annually to gauge progress.
FAQs
What does a 0.76 performance index signify for TPCODL?
It indicates a relatively high level of operational efficiency, lower losses, and strong revenue collection compared with peers.
Why is SBPDCL’s index lower than TPCODL’s?
Factors include older infrastructure, a higher proportion of rural consumers, and less investment in smart grid technologies.
How can distribution companies improve their performance scores?
By upgrading transmission assets, implementing advanced metering, reducing technical losses, and enhancing billing efficiency.
Do these indices affect electricity tariffs for consumers?
Yes, higher efficiency typically allows utilities to keep tariffs lower, while lower scores can lead to higher charges to cover losses.
What role does Eninrac Consulting play in interpreting utility data?
Eninrac provides expert analysis, benchmarks performance, and offers strategic recommendations to improve utility operations.