
Introduction
India August 2026 thermal nuclear power generation data offers a comprehensive snapshot of how the country’s electricity mix performed across its major geographic zones during the fifth month of the fiscal year. The report lists programmed capacity versus actual output for both thermal and nuclear sources, totals for the nation and a regional breakdown for the north, west, south, east and north‑east. Understanding these figures is essential for policymakers, investors, and industry analysts who track supply reliability, fuel procurement, and future capacity planning. This article interprets the numbers, highlights significant trends, and explains why the August 2026 results matter for India’s broader energy transition.
What Does the Data Reveal About This Topic?
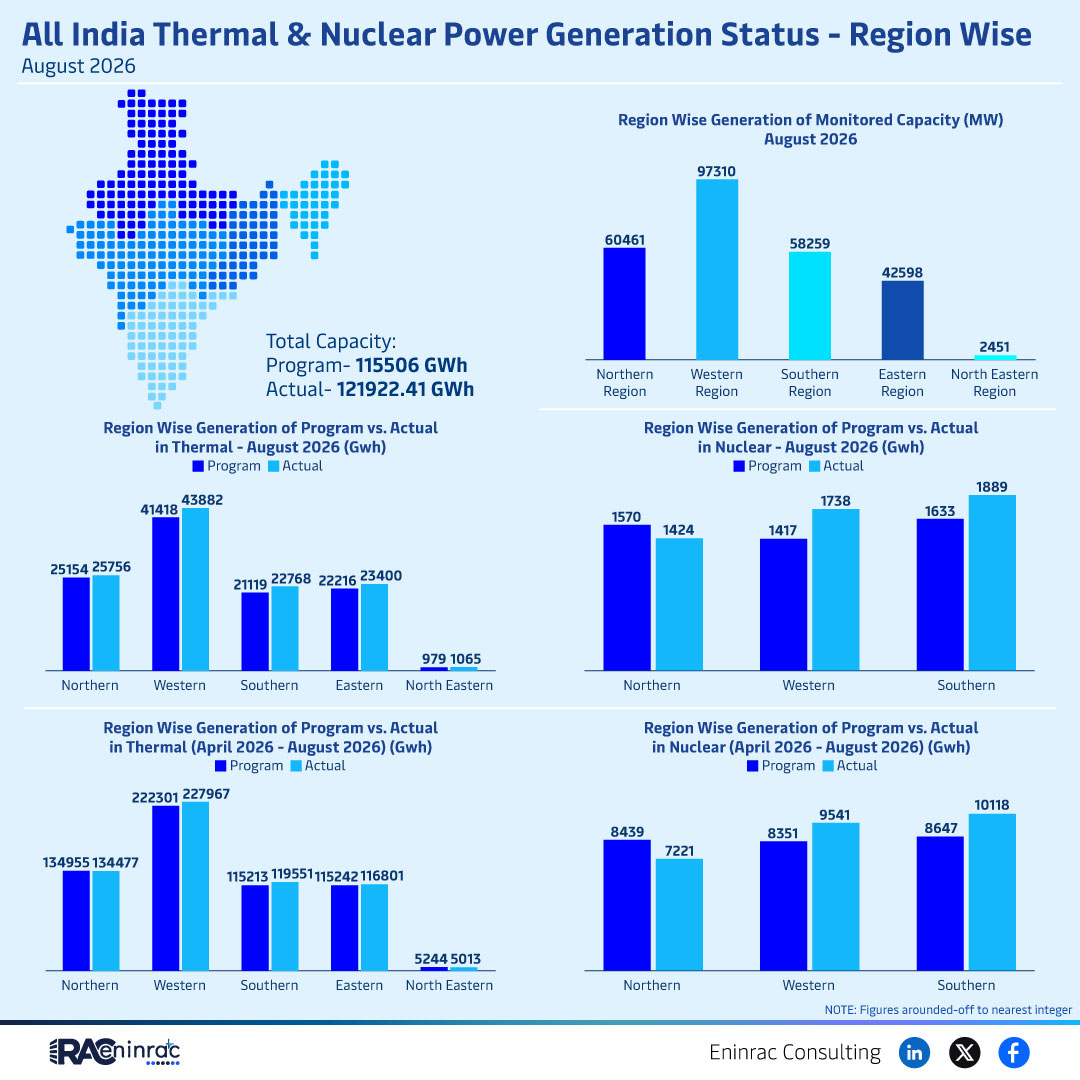
The core insight from the August 2026 dataset is that actual generation exceeded the programmed target by roughly 6 % at the national level, with total actual output reaching 121,922 GWh compared with a planned 115,506 GWh. Thermal plants contributed the bulk of the surplus, delivering 97,310 MW of monitored capacity, while nuclear facilities added 4,382 MW of programmed capacity and slightly outperformed expectations in several regions. Regionally, the northern and western zones led thermal production, whereas the eastern and north‑eastern regions showed modest gains in nuclear output. These patterns suggest that seasonal demand spikes, fuel availability and plant availability factors combined to push actual generation above forecasted levels.
Regional Performance in Thermal and Nuclear Power
Examining each region reveals distinct dynamics between thermal and nuclear contributions. In the north, thermal capacity reached 58,259 MW, making it the largest single‑region output and reflecting the concentration of coal‑fired plants in that belt. The west produced 42,598 MW of thermal power, supported by a mix of older coal units and newer gas‑based stations. The south contributed 22,768 MW, while the east recorded 22,216 MW and the north‑east 23,400 MW, indicating a relatively balanced distribution of thermal assets across the lower‑demand zones. Nuclear generation showed a more modest spread: the north reported 4,382 MW of programmed capacity, the west 1,738 MW, the south 1,570 MW, the east 1,633 MW and the north‑east 1,424 MW. Actual nuclear output in several regions marginally surpassed programmed levels, highlighting operational efficiency gains at plants such as Kudankulam and Tarapur during the August reporting window.
Impact on Sectors and Industries
The August 2026 performance has direct implications for multiple sectors. Utilities can leverage the higher‑than‑expected output to defer short‑term procurement of imported coal or gas, improving cash flow. Independent power producers (IPPs) observing the regional thermal surplus may adjust bidding strategies in upcoming capacity auctions. Investors tracking nuclear reliability see evidence that India’s nuclear fleet is delivering steady, incremental capacity, supporting long‑term financing of new reactors. Policymakers can use the data to validate demand forecasts, refine grid stability models, and prioritize transmission upgrades in regions where generation spikes are most pronounced. Finally, energy‑intensive industries such as steel, cement and chemicals benefit from a more reliable supply, potentially lowering production costs.
Key Takeaways
- Actual generation in August 2026 topped programmed capacity by about 6 %, indicating a strong performance across thermal plants.
- Northern and western regions dominated thermal output, together contributing over half of the nation’s total thermal generation.
- Nuclear output slightly exceeded its programmed target, demonstrating improved plant availability at key sites.
- The surplus in actual generation can help reduce reliance on imported fuel and improve grid stability.
- Regional disparities suggest targeted investments are needed in the eastern and north‑eastern zones to balance capacity.
- Policymakers can use these August figures to refine future capacity planning and incentive structures for clean energy.
FAQs
Did India meet its power generation targets in August 2026?
Yes, actual generation of 121,922 GWh exceeded the programmed target of 115,506 GWh.
Which region produced the most thermal power in August 2026?
The northern region, with 58,259 MW, was the leading thermal power producer.
How did nuclear generation perform compared to its plan?
Nuclear output marginally surpassed programmed levels in most regions, showing better than expected plant availability.
What implications does the August surplus have for fuel imports?
Higher than planned generation can lower the need for imported coal and gas, improving the trade balance.
How can investors use this regional generation data?
Investors can assess regional supply trends to adjust bidding strategies and target growth opportunities in high‑output zones.