
Introduction
The June 2026 bio power generation capacity report for India provides a detailed snapshot of how renewable biomass energy is expanding across the country. Understanding state‑wise capacity, recent additions, and growth rates is essential for investors, policymakers, and industry observers who track India’s transition to cleaner power sources. This article breaks down the latest numbers, explains what they reveal about regional performance, and outlines the implications for the broader energy landscape.
What Does the Data Reveal About This Topic?
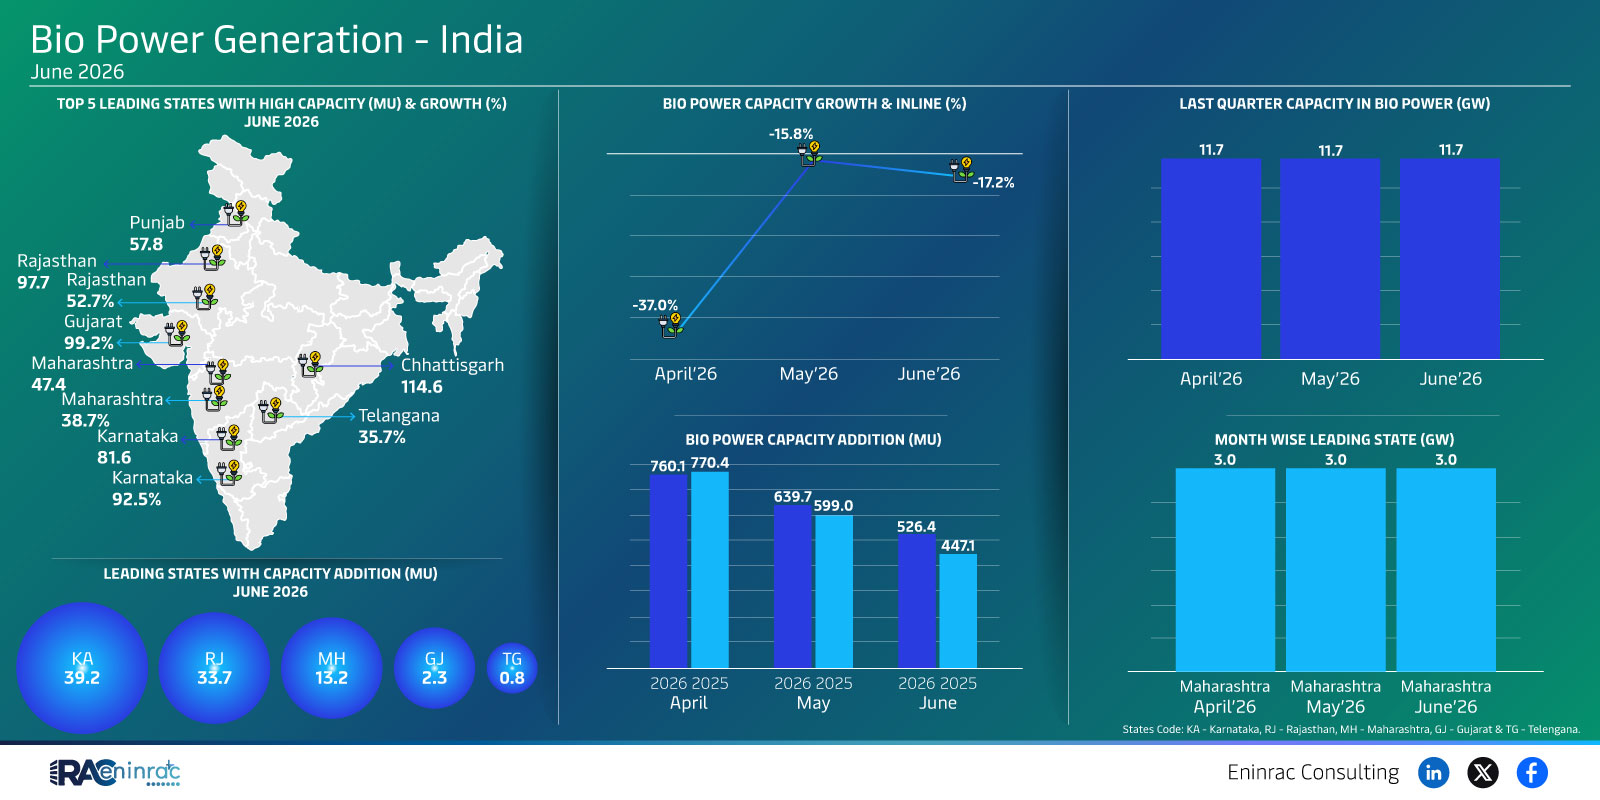
Which Indian states are leading the surge in bio power generation capacity and why does this matter? The data shows Rajasthan, Maharashtra, Karnataka, Punjab and Telangana as the top contributors, with Maharashtra consistently adding about 3 GW each month in April, May and June 2026. Growth patterns indicate that while Rajasthan holds the highest overall capacity, Maharashtra’s monthly additions demonstrate aggressive expansion, highlighting differing development strategies among states.
State‑wise Capacity and Monthly Additions Compared
Analyzing the figures side by side reveals distinct trends. Rajasthan reports a capacity of 97.7 MU, positioning it as the highest‑capacity state, yet its growth rate has slowed, reflected by a negative change of –37.0 MU in the last quarter. Maharashtra, on the other hand, shows a steady addition of roughly 3 GW per month, making it the leading state for monthly capacity growth in the June quarter. Karnataka records 35.7 MU, while Punjab contributes 57.8 MU. Telangana and Gujarat also display modest yet consistent increases, underscoring a geographically diverse expansion of bio power generation capacity.
Impact on Sectors and Industries
The upward trajectory of bio power capacity influences multiple sectors. Renewable energy developers gain clearer market signals for project financing, while utilities can diversify their generation mix to meet national clean‑energy targets. Policy makers receive data‑driven insights to shape incentives, grid integration plans, and environmental regulations. Moreover, agricultural waste suppliers find new revenue streams as biomass fuel demand rises, linking rural economies with the national power grid.
Key Takeaways
- Rajasthan leads in total bio power capacity but faces a recent decline.
- Maharashtra adds the most bio power each month, showing strong growth momentum.
- Karnataka, Punjab and Telangana maintain steady contributions to national capacity.
- Monthly additions of around 3 GW highlight accelerating investment in biomass projects.
- State‑level trends guide policy incentives and financing decisions.
- Growth in bio power supports India’s broader renewable energy and sustainability goals.
FAQs
Which state has the highest bio power capacity in June 2026?
Rajasthan tops the list with approximately 97.7 MU of bio power generation capacity.
What is Maharashtra’s monthly addition for bio power?
Maharashtra consistently adds about 3 GW of bio power capacity each month in April, May and June 2026.
Why did Rajasthan’s capacity growth turn negative?
The negative change of –37.0 MU reflects a slowdown in new projects and possible operational setbacks during the last quarter.
How do these trends affect renewable energy investors?
Clear state‑wise performance data helps investors target high‑growth regions like Maharashtra while assessing risk in slower‑growing states.
What role does bio power play in India’s clean energy goals?
Bio power adds diversified renewable capacity, supports waste management, and contributes to national emissions reduction targets.