
Introduction
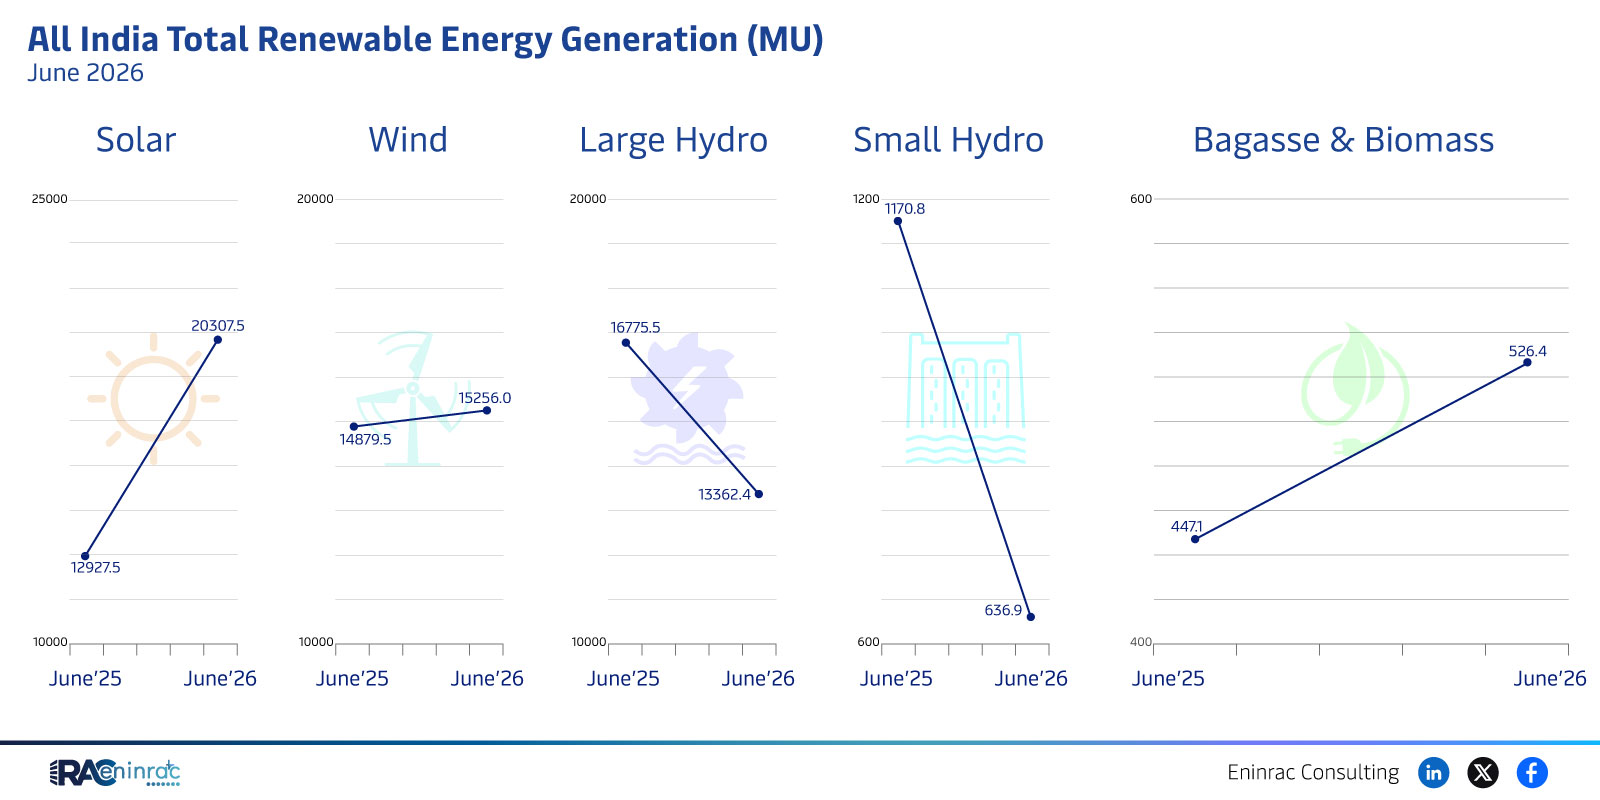
India’s renewable energy landscape in June 2026 shows a striking increase in generation across multiple sources. The data reveals the total renewable output measured in million units (MU) for solar, wind, large hydro, small hydro, and bagasse‑and‑biomass. Understanding these figures helps policymakers, investors and the public gauge progress toward national clean‑energy goals and assess where future capacity expansions may be most impactful.
What Does the Data Reveal About This Topic?
The June 2026 snapshot indicates that solar contributed 25,000 MU, wind added 20,000 MU, and large hydro also generated 20,000 MU. Smaller contributors include small hydro at 200 MU and bagasse & biomass around 708 MU, highlighting the dominance of solar and wind in the renewable mix while hydro remains a vital base‑load source. This distribution underscores the shift from fossil‑fuel reliance toward a diversified renewable portfolio.
Solar vs Wind vs Hydro Performance in June 2026
Comparing the three major categories, solar leads with the highest generation, reflecting continued cost reductions and large‑scale deployment across sunny regions. Wind power follows closely, benefiting from offshore projects and improved turbine efficiency. Large hydro matches wind output, suggesting that existing reservoir and river‑based installations still play a crucial role in meeting demand, especially during peak periods. Small hydro and biomass remain niche contributors but provide localized stability in remote areas.
Impact on Sectors and Industries
The surge in renewable generation influences several sectors. Power utilities must integrate higher variable output, prompting investments in grid flexibility, storage and smart‑grid technologies. Manufacturing of solar panels and wind turbines sees heightened demand, driving job creation and export potential. Investors are drawn to renewable assets due to stable returns and policy support, while policymakers can justify continued incentives and infrastructure planning to sustain growth.
Key Takeaways
- Solar generation reached 25,000 MU, the highest among all renewable sources.
- Wind and large hydro each supplied 20,000 MU, showing balanced growth.
- Small hydro and biomass contributions are modest but essential for regional reliability.
- The data confirms India’s accelerating transition toward a renewable‑dominant energy mix.
- Increasing renewable output drives demand for grid modernization and storage solutions.
- Policy support and private investment are likely to grow as generation capacity expands.
FAQs
What was the total renewable generation in India for June 2026?
The combined renewable generation for June 2026 summed to approximately 65,908 MU across all sources.
Which renewable source generated the most power in June 2026?
Solar power led the list, producing 25,000 MU of electricity.
How does large hydro compare to wind in June 2026?
Both large hydro and wind each generated 20,000 MU, indicating comparable performance.
Why are small hydro and biomass contributions relatively low?
These sources are geographically limited and serve specific local needs, resulting in lower overall output.
What implications does this data have for future energy policy?
The strong performance of solar and wind supports continued incentives, grid upgrades and investment in storage to accommodate higher renewable shares.