
Introduction
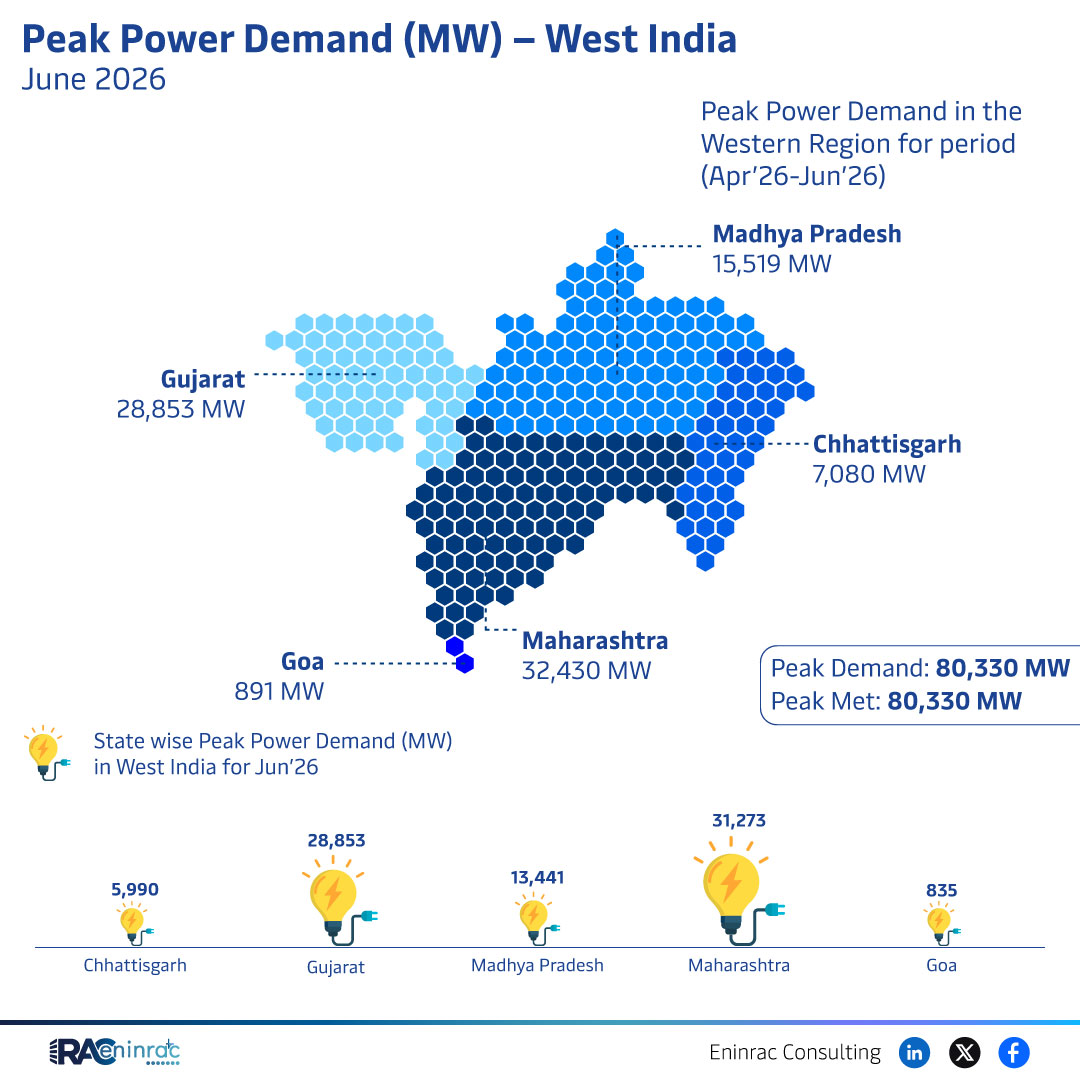
The June 2026 report released by Eninrac Consulting highlights the West India peak power demand at a record 80,330 MW. This figure reflects the combined electricity load of the region’s major states during the summer peak period. Understanding these numbers is essential for grid operators, investors, and policymakers who manage supply reliability. The article explains the state‑wise distribution and the broader implications for the Indian power sector.
What Does the Data Reveal About This Topic?
Which states contributed the most to the 80,330 MW peak? Maharashtra led with 32,430 MW, followed closely by Gujarat at 28,853 MW, while Madhya Pradesh added 15,519 MW and Chhattisgarh supplied 7,080 MW. The data shows a clear concentration of demand in the two largest economies of the western zone. It also indicates that the overall demand spikes during the summer months, stressing the need for robust transmission capacity. These insights help stakeholders anticipate load growth and plan infrastructure upgrades.
State‑wise Peak Demand Highlights
Maharashtra’s 32,430 MW accounts for roughly 40 % of the regional peak, underscoring its industrial and urban consumption. Gujarat’s 28,853 MW represents nearly 36 % and reflects strong manufacturing and agricultural irrigation needs. Madhya Pradesh’s 15,519 MW, while lower, still contributes a significant 19 % of the total load. Chhattisgarh, with 7,080 MW, adds about 9 % and highlights rising demand from mining and power‑intensive projects. The disparity among states points to varying economic activities, climate conditions, and grid connectivity levels across West India.
Impact on Sectors and Industries
The high peak demand influences multiple sectors. Power‑intensive industries such as steel, chemicals, and automotive must coordinate with utilities to secure reliable supply. Renewable energy developers can target capacity additions in states where demand outpaces existing generation. Financial markets monitor these figures to assess the profitability of transmission and distribution assets. Policymakers use the data to justify investments in grid reinforcement, demand‑side management, and regional interconnections. Consumers benefit from better planning that reduces the risk of blackouts during peak summer days.
Key Takeaways
- Maharashtra leads West India with 32,430 MW, the largest single‑state contribution.
- Gujarat follows closely, supplying 28,853 MW to the regional peak.
- Madhya Pradesh adds 15,519 MW, highlighting its growing industrial load.
- Chhattisgarh’s 7,080 MW shows demand expansion in mining regions.
- Combined, the four states drive the 80,330 MW peak for June 2026.
- Understanding these figures supports grid planning, investment decisions, and policy formation.
FAQs
What caused the peak demand to reach 80,330 MW in June 2026?
Summer temperatures, industrial activity, and agricultural irrigation increased electricity consumption across the western states.
How does Maharashtra’s demand compare to the other states?
Maharashtra contributed the highest share at 32,430 MW, accounting for about 40 % of the total West India peak.
Why is Gujarat’s demand so high?
Gujarat’s strong manufacturing base and extensive use of water pumps for irrigation drive its 28,853 MW load.
What role do renewable sources play in meeting this peak?
Renewables are gradually expanding, but the peak still relies heavily on conventional thermal generation.
How can policymakers use this data?
They can prioritize transmission upgrades, incentivize demand‑side management, and support capacity addition in high‑demand states.