
Introduction
Renewable Energy Generation India June 2026 provides a snapshot of how the country’s clean power sector performed in the middle of the year. The data, compiled by Eninrac Consulting, highlights the contribution of solar and wind assets across the five leading states, the top generating stations, and the regional distribution of power output. Understanding these figures is essential for investors, policymakers, and industry stakeholders who track progress toward national renewable targets and assess where future capacity will be added.
What Does the Data Reveal About This Topic?
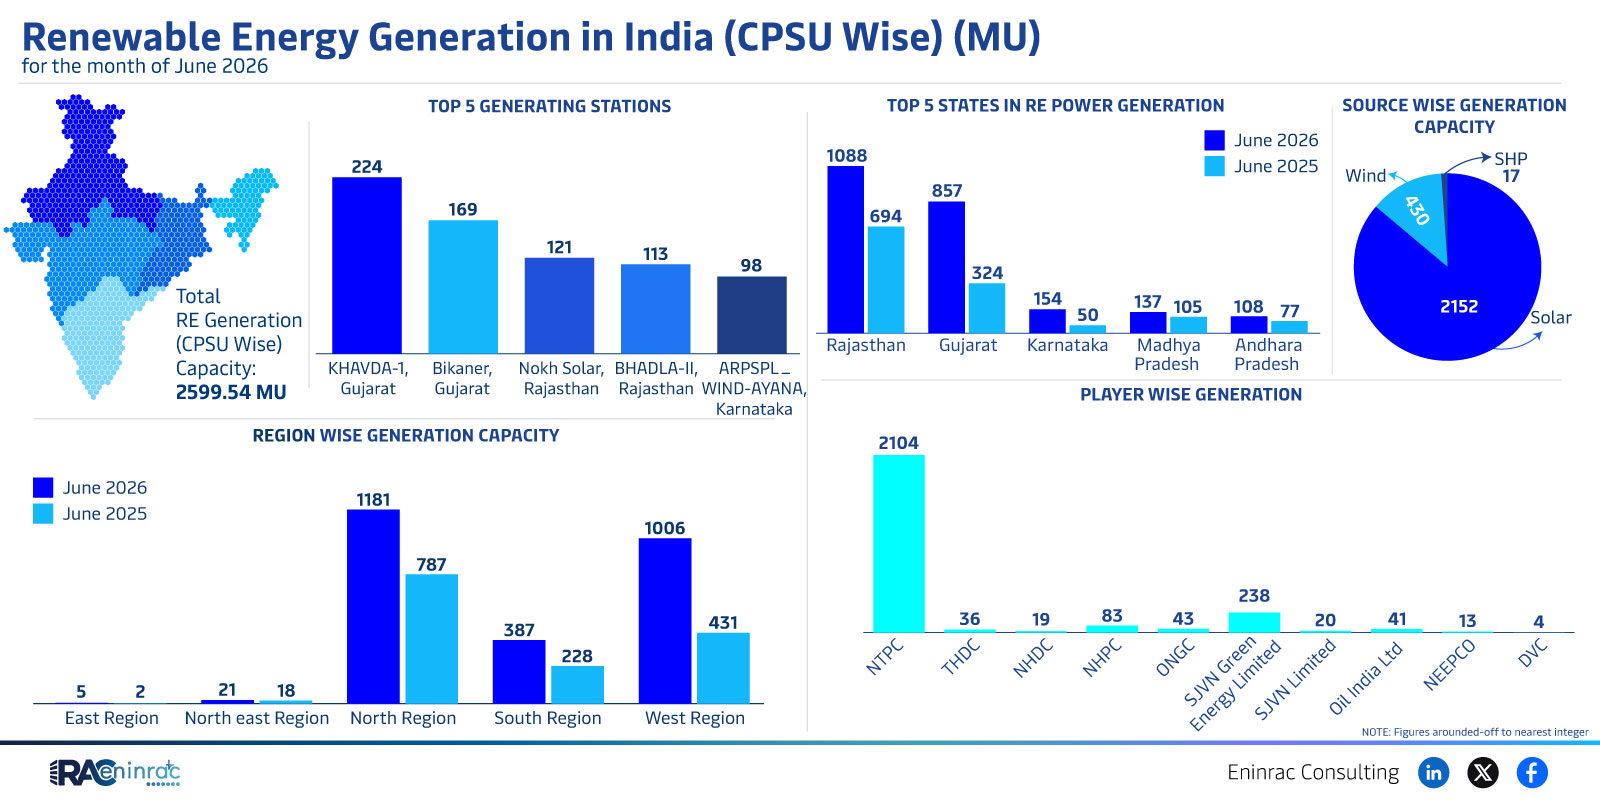
What does the June 2026 dataset tell us about the balance of renewable sources in India? The numbers show that Rajasthan, Gujarat, Karnataka, Madhya Pradesh and Andhra Pradesh together accounted for the bulk of generation, with wind and solar plants in these states driving the majority of output. The top five stations – KHAVDA‑1, Bikaner, Nokh Solar, BHADLA‑II and ARPSPL – together contributed close to 2,600 MU, indicating a strong concentration of capacity in a few high‑performing facilities.
Statewise and Plantwise Performance Highlights
When we compare state performance, Gujarat and Rajasthan emerge as the clear leaders, each delivering over 1,000 MU in the month. Karnataka follows with a substantial share, while Madhya Pradesh and Andhra Pradesh provide meaningful but smaller contributions. Regionally, the West and North zones dominate, reflecting the geographic placement of large solar farms in the arid west and extensive wind corridors in the north. The data also points to a modest rise in overall capacity, with a reported total generation of approximately 2,104 MU across all regions, suggesting that new projects are beginning to add measurable output.
Impact on Sectors and Industries
The trends captured in the June 2026 report have direct implications for several key sectors. Power utilities can better plan grid integration strategies as the share of intermittent solar and wind rises. Financial institutions see clearer risk profiles for renewable project financing, especially in the high‑output states. Policymakers gain evidence to refine incentive structures, targeting under‑served regions such as the East and South where generation remains lower. Finally, equipment manufacturers and EPC firms can align their production pipelines with the demonstrated demand in the leading states.
Key Takeaways
- Rajasthan and Gujarat together supplied more than half of June’s renewable output.
- Top five stations contributed nearly 2,600 MU, underscoring concentration of capacity.
- Solar dominates in Gujarat, while wind is strongest in Rajasthan.
- West and North regions outperformed East, South and Central zones.
- Total reported generation reached about 2,104 MU for June 2026.
- Data highlights investment opportunities in under‑represented East and South regions.
FAQs
Which Indian state generated the most renewable energy in June 2026?
Gujarat led the rankings, delivering the highest megawatt‑hour output among all states during the month.
What are the leading renewable power stations in the June 2026 report?
The top five stations were KHAVDA‑1, Bikaner, Nokh Solar, BHADLA‑II and ARPSPL, together accounting for close to 2,600 MU.
How does wind power compare to solar in the top states?
Solar capacity dominates in Gujarat, whereas wind generation is the primary contributor in Rajasthan, reflecting regional resource strengths.
What regions showed the lowest renewable generation?
The East and South regions reported the smallest outputs, indicating potential for future development.
Why is this data important for investors?
It reveals where capacity is already concentrated and where gaps exist, helping investors target new projects and allocate capital efficiently.