
Introduction
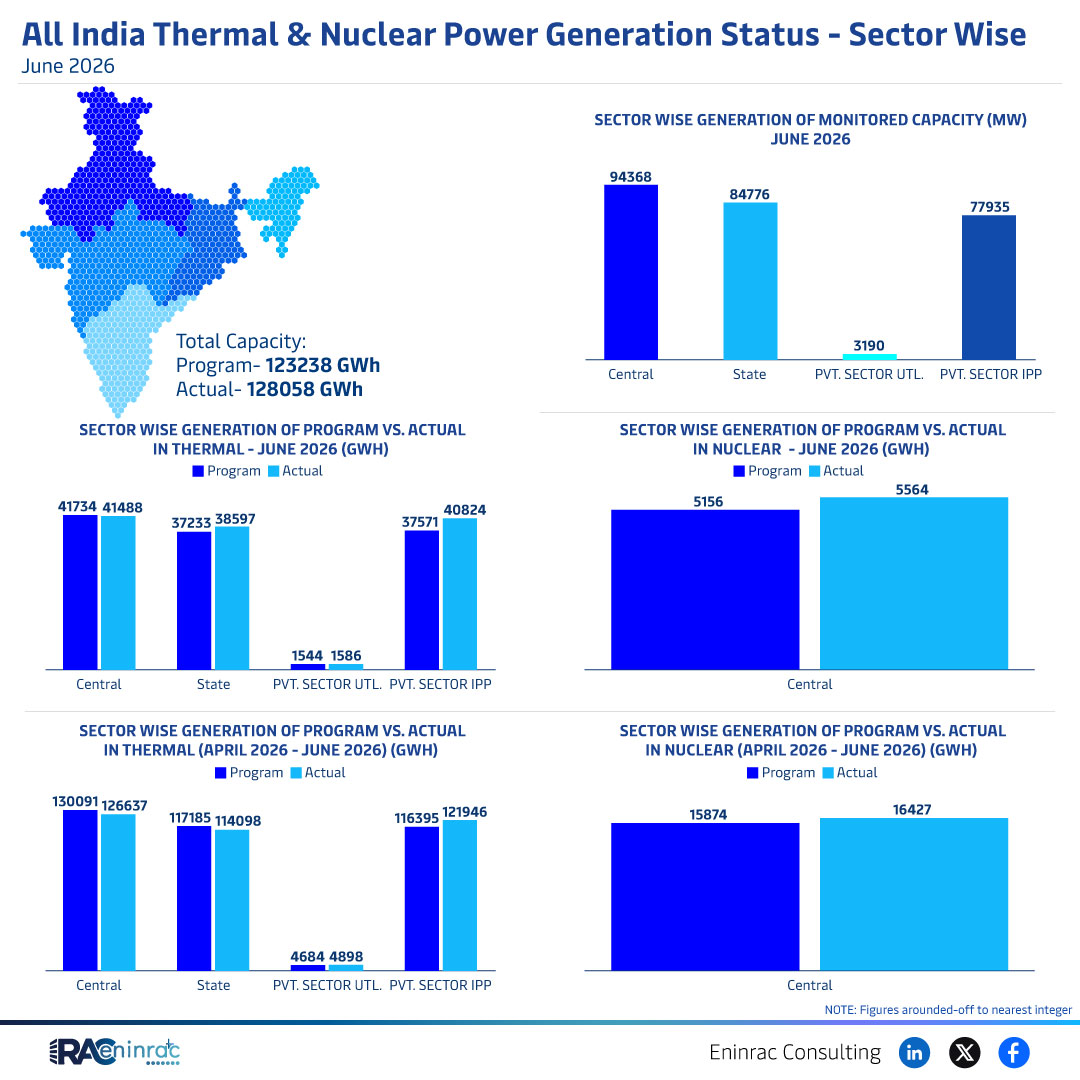
The All India Thermal & Nuclear Power Generation Status for June 2026 provides a detailed snapshot of how India’s power sector performed against its scheduled programme. It reveals the total generation capacity, the split between thermal and nuclear sources, and the performance of central, state and private entities. Readers will learn where actual output differed from planned targets, the trend across the quarter, and the implications for policymakers and investors.
What Does the Data Reveal About This Topic?
Does the June 2026 data show that India met its electricity generation goals? The figures indicate that overall generation exceeded the programme, with total actual generation of 128,058 GWh compared with a planned 123,238 GWh. However, the breakdown shows a mixed picture: thermal generation in some sectors fell short of the programme, while nuclear output was slightly below its target.
Thermal vs Nuclear Performance Across Sectors
Thermal generation for June 2026 recorded programme values of 41,734 GWh, 37,233 GWh and 1,544 GWh across three unspecified segments, while actual outputs were 41,488 GWh, 38,537 GWh and 1,586 GWh respectively. This suggests a modest over‑performance in the smallest segment and a shortfall in the larger ones. Nuclear generation showed a programme of 5,564 GWh against an actual 5,156 GWh, indicating a shortfall of about 7 percent. Monitored capacity data list 94,368 MW, 84,776 MW and 77,935 MW for central, state and private participants, highlighting the dominance of central utilities in installed capacity.
Impact on Sectors and Industries
The divergence between programme and actual output influences several stakeholders. Investors monitor actual performance to assess the reliability of power assets, while policymakers use the data to fine‑tune fuel allocation, grid stability measures and renewable integration plans. The slight nuclear shortfall may prompt a review of fuel supply chains, whereas the thermal sector’s mixed results could affect tariff revisions and future capacity‑addition decisions.
Key Takeaways
- Total actual generation (128,058 GWh) exceeded the programme (123,238 GWh).
- Thermal generation was below programme in larger segments but marginally above in the smallest.
- Nuclear output lagged its target by roughly 400 GWh.
- Central utilities hold the largest monitored capacity at 94,368 MW.
- State and private sectors together contribute around 162,711 MW of capacity.
- Data underline the need for tighter fuel and resource planning for June 2026.
FAQs
Did India’s total power generation meet the June 2026 target?
Yes, total actual generation of 128,058 GWh surpassed the programme target of 123,238 GWh.
Which sector showed the biggest shortfall?
The nuclear sector recorded the largest relative shortfall, delivering 5,156 GWh against a planned 5,564 GWh.
How does monitored capacity differ across central, state and private players?
Central utilities have the highest monitored capacity at 94,368 MW, followed by state (84,776 MW) and private (77,935 MW) participants.
What does the thermal generation variance indicate?
Thermal generation was slightly below the programme in larger segments, suggesting possible fuel or operational constraints, while a minor segment exceeded its target.
Why is this data important for investors?
Investors rely on actual vs programme performance to gauge asset reliability, assess risk, and make informed decisions on future power projects.