
Introduction
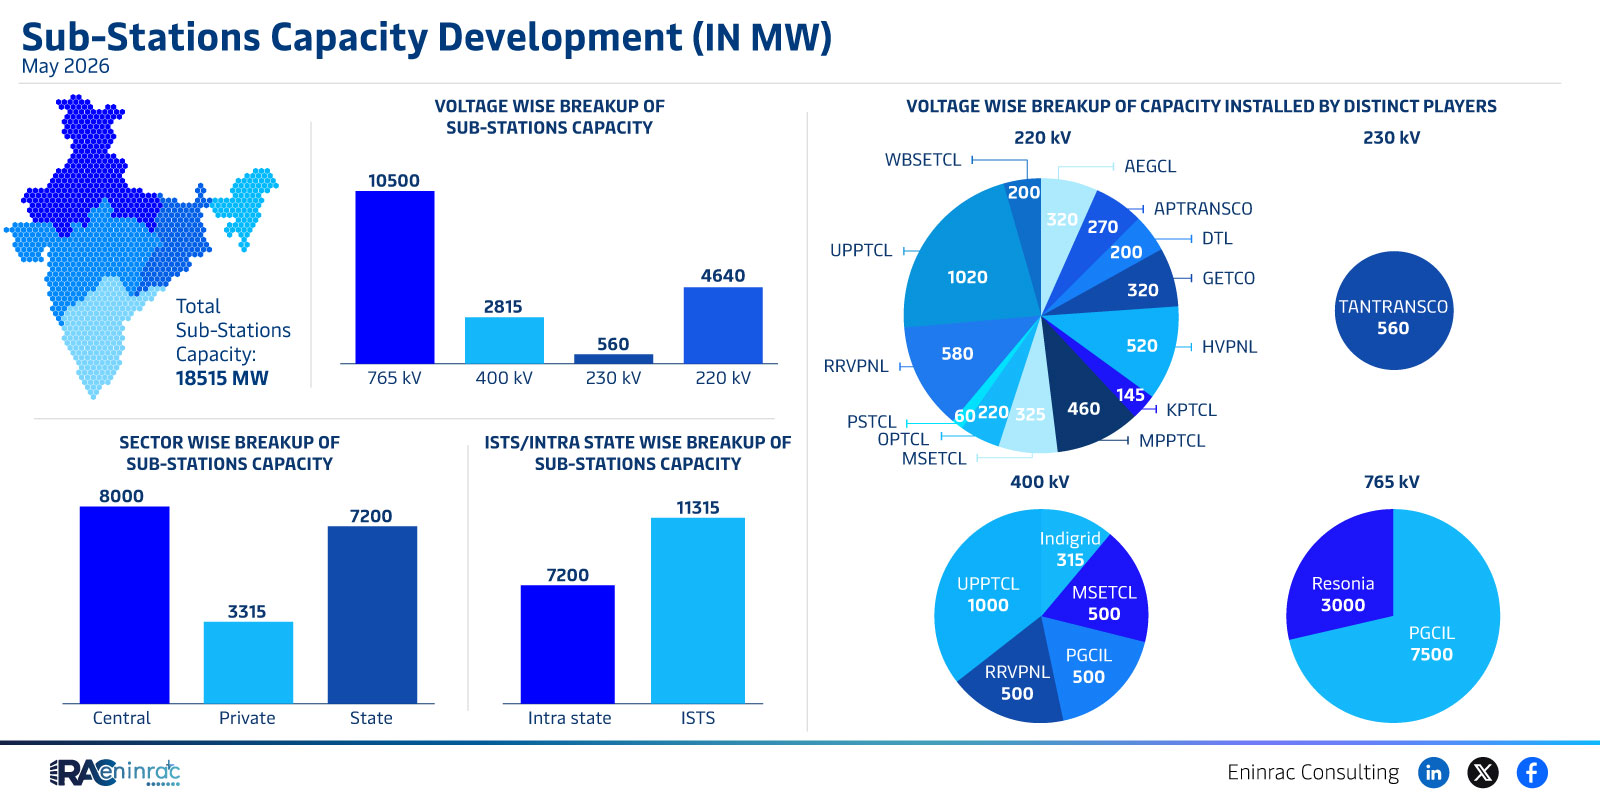
The May 2026 sub‑station capacity development report aggregates the total installed capacity of Indian substations at 18,515 MW. This figure combines contributions from central, state and private transmission entities and is broken down by voltage level, geographic region and ownership type. Understanding how this capacity is distributed helps utilities, investors and policymakers evaluate grid resilience, plan future upgrades and assess the adequacy of transmission infrastructure to support growing demand and renewable integration.
What Does the Data Reveal About This Topic?
The data shows a clear dominance of high‑voltage assets, with 400 kV, 500 kV, 765 kV and 1,000 kV lines accounting for the majority of the 18,515 MW capacity. State‑run utilities such as WBSETCL, APTRANSCO and UPPTCL together contribute over half of the total capacity, while private players like GCIL and RRVPNL add significant volumes at the 500 kV and 765 kV levels. The intra‑state versus inter‑state split highlights that most capacity is allocated for intra‑state distribution, emphasizing the focus on regional grid strengthening.
Voltage Level Distribution across Indian Regions
When examined by voltage, the 230 kV tier holds approximately 560 MW, serving primarily medium‑load corridors, whereas the 400 kV and 500 kV tiers host 315 MW and 500 MW respectively, linking major generation hubs with load centres. The 765 kV corridor, largely owned by GCIL, contributes 500 MW, and the 1,000 kV corridor adds another 500 MW, reflecting strategic corridors for bulk power transfer. Central utilities dominate the 230 kV and 400 kV segments, while state utilities such as KPTCL and MPPTCL are prominent at 500 kV. This voltage mix supports both long‑distance transmission and regional reinforcement.
Impact on Sectors and Industries
Robust sub‑station capacity underpins the reliability of the power sector, influencing industrial output, commercial activity and residential consumption. High‑voltage expansion reduces transmission losses, improves renewable integration, and attracts investment in manufacturing and data‑center zones. Policymakers can leverage the capacity map to prioritize upgrades in lagging regions, while investors gain insight into which utilities are expanding assets and where growth opportunities exist. For consumers, increased capacity translates into fewer outages and more stable electricity pricing.
Key Takeaways
- The total sub‑station capacity in India reached 18,515 MW in May 2026.
- High‑voltage assets (400 kV, 500 kV, 765 kV and 1,000 kV) constitute the bulk of capacity.
- State utilities contribute the majority of installed capacity across voltage tiers.
- Private transmission players hold significant shares at 500 kV and 765 kV levels.
- Intra‑state capacity dominates, highlighting focus on regional grid reinforcement.
- Voltage diversity supports both bulk power transfer and regional distribution needs.
FAQs
What is the total sub‑station capacity reported for May 2026?
The report records a combined capacity of 18,515 MW across all Indian substations.
Which voltage level has the highest capacity share?
The 500 kV and 1,000 kV tiers together hold the largest share of installed capacity.
Who are the leading owners of high‑voltage substations?
Central utilities like WBSETCL and state utilities such as APTRANSCO, UPPTCL and private firms like GCIL lead the high‑voltage portfolio.
How does this capacity affect renewable energy integration?
Higher voltage corridors reduce losses and provide stable pathways for large‑scale solar and wind projects.
What does the intra‑state versus inter‑state split indicate?
It shows a focus on strengthening regional networks, ensuring reliable power delivery within states.