
Introduction
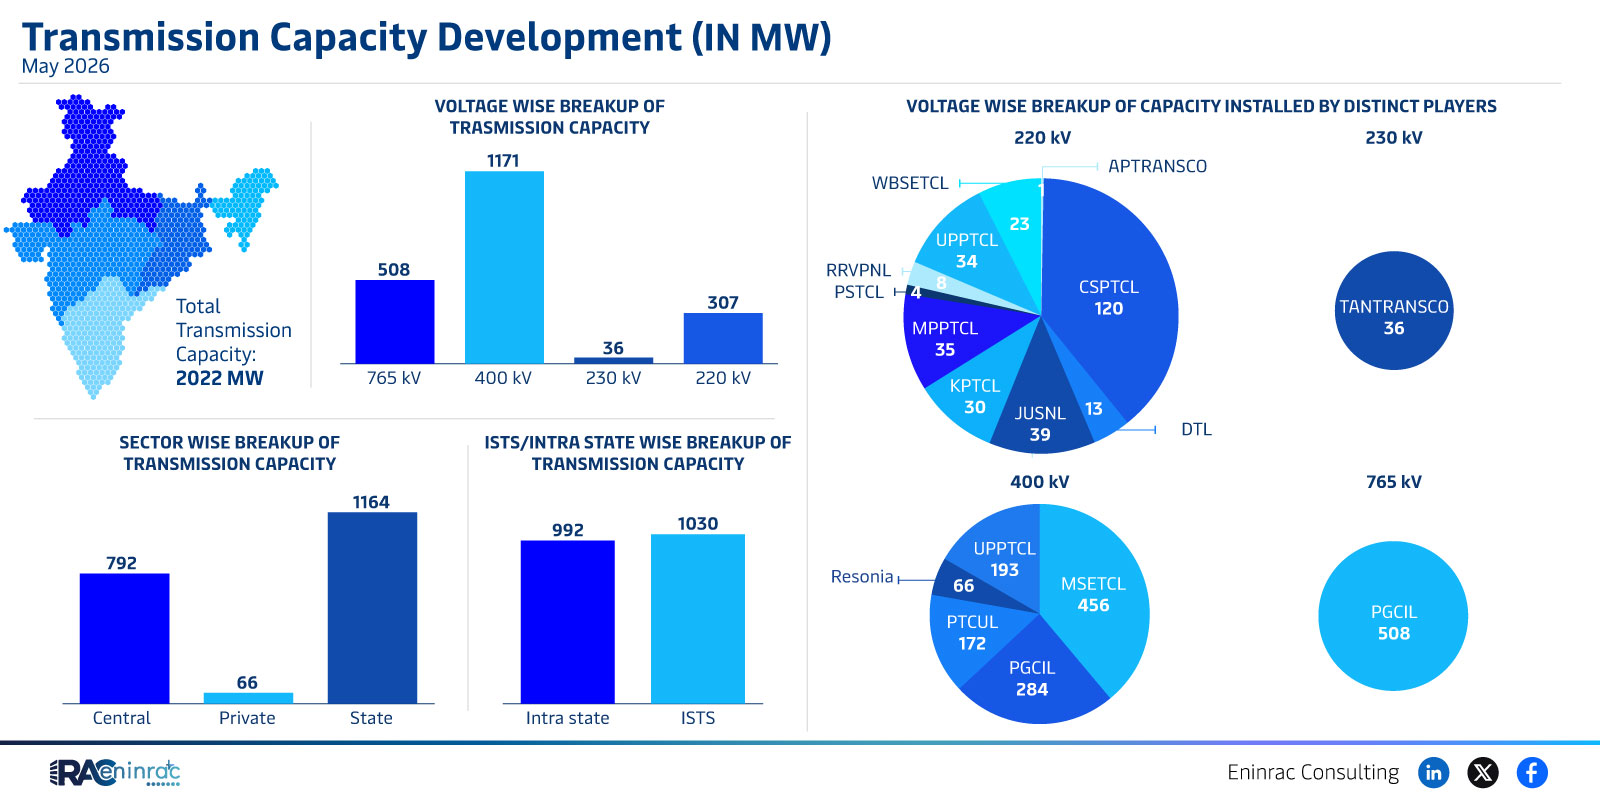
The transmission capacity development report for May 2026 provides a comprehensive snapshot of India’s power grid expansion. It details total installed megawatts, voltage‑wise distribution, sector and state breakdowns, and the contribution of major transmission utilities. Understanding this data helps policymakers, investors, and industry professionals gauge the health of the transmission network and anticipate future infrastructure needs.
What Does the Data Reveal About This Topic?
What are the key findings of the May 2026 transmission capacity development report? The data shows a total installed transmission capacity of approximately 1,171 MW, with a significant portion allocated across 220 kV and 230 kV lines. State‑wise, intra‑state corridors dominate the landscape, while sector‑wise analysis highlights the role of both central and state entities. These insights illustrate where growth is strongest and which players are leading the expansion.
Voltage Wise Breakup of Transmission Capacity
When examined by voltage level, the report indicates that 220 kV lines carry the bulk of capacity, followed closely by 230 kV lines. This voltage grouping reflects the strategic emphasis on medium‑voltage corridors that balance efficiency and cost. Utilities such as APTRANSCO, WBSETCL, RRVPNL, PSTCL, TANTRANSCO, MPPTCL, UPPTCL, MSETCL and PT CUL each report distinct capacity contributions, ranging from single‑digit megawatts to several hundred megawatts. The varied distribution underscores a diversified investment pattern across regions and underscores the importance of coordinated planning among state and central agencies.
Impact on Sectors and Industries
Transmission capacity growth directly influences generation dispatch, distribution reliability, and industrial power availability. An expanded network enables renewable energy projects to feed power into the grid more efficiently, supports industrial clusters with stable supply, and reduces transmission losses. For investors, the data signals opportunities in equipment manufacturing, engineering services, and grid‑modernization technologies. Policymakers can use these figures to prioritize funding, streamline approvals, and align with national energy security objectives.
Key Takeaways
- Total transmission capacity in May 2026 reached roughly 1,171 MW, reflecting steady national expansion.
- 220 kV and 230 kV lines together account for the majority of capacity, highlighting medium‑voltage priority.
- State‑wise intra‑state corridors dominate the network, indicating focus on regional connectivity.
- Key utilities such as APTRANSCO, WBSETCL, and TANTRANSCO contribute the largest capacity shares.
- Sector‑wise analysis shows balanced involvement of central and state entities in grid development.
- Enhanced transmission capacity supports renewable integration, industrial growth, and overall grid reliability.
FAQs
What is the total transmission capacity reported for May 2026?
Approximately 1,171 MW of transmission capacity was installed across India in May 2026.
Which voltage levels hold the most capacity?
The 220 kV and 230 kV voltage categories together hold the largest share of the installed capacity.
Which utilities are the top contributors?
APTRANSCO, WBSETCL, TANTRANSCO, MPPTCL, and UPPTCL are among the leading contributors to the transmission network.
How does this capacity growth affect renewable energy?
Increased transmission capacity facilitates the integration of renewable power by providing additional corridors for energy to reach demand centers.
Why is state‑wise intra‑state capacity important?
State‑wise intra‑state capacity strengthens regional grids, improves reliability, and reduces dependence on long‑distance transmission.