
Introduction
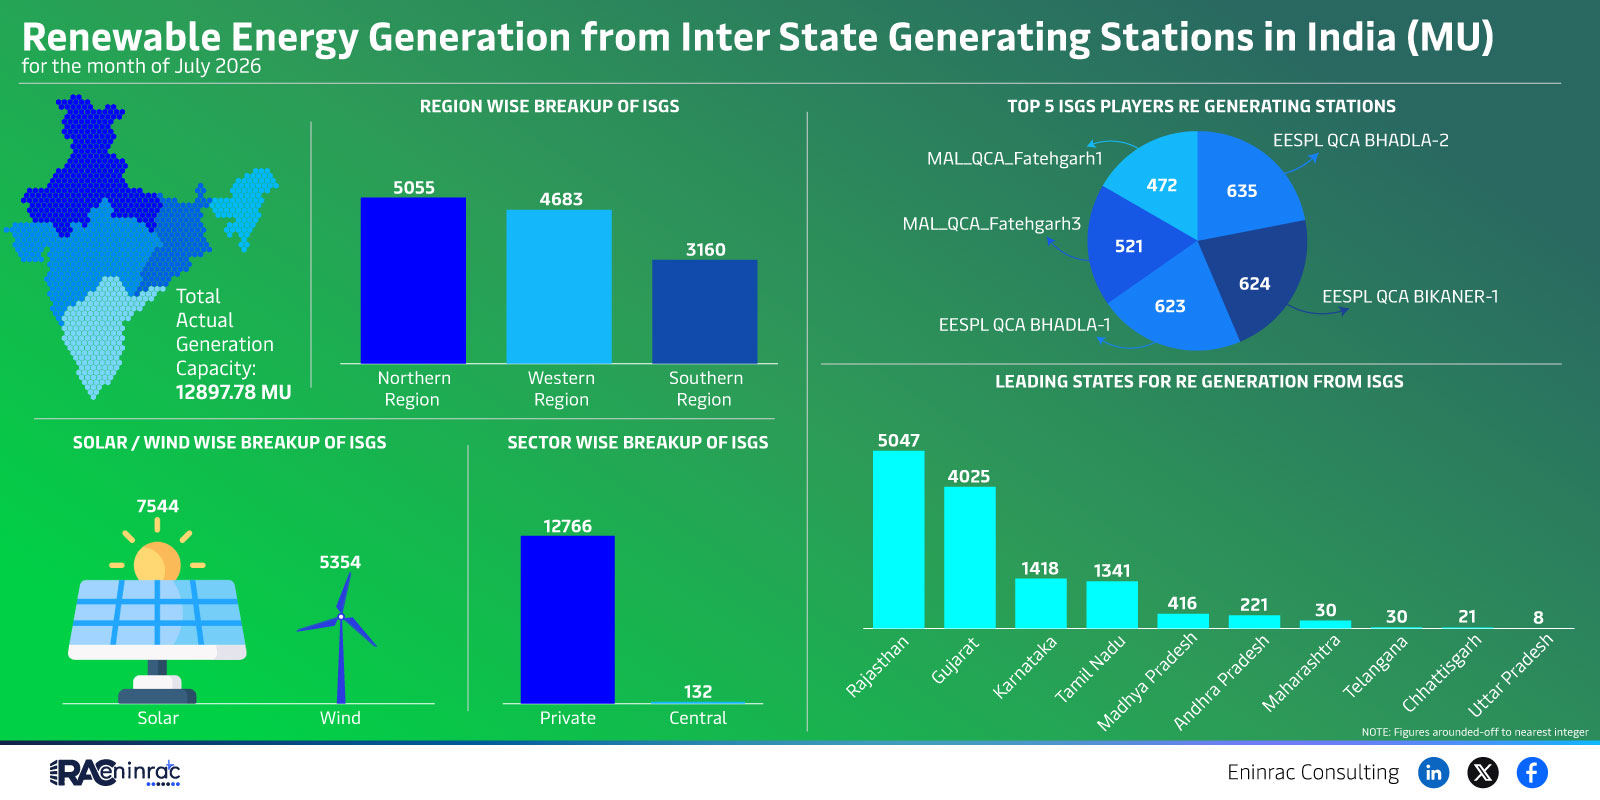
Renewable Energy Generation from ISGS in India saw a notable performance in July 2024, delivering a total of 12,897.78 million units (MU). This data highlights the growing contribution of interstate generating stations to the nation’s clean energy mix. Readers will discover the regional breakdown, sector contributions, leading players, and the broader implications for policy makers, investors, and the energy market.
What Does the Data Reveal About This Topic?
The July figures indicate that solar power accounted for 7,544 MU while wind contributed 5,354 MU, together representing more than 95% of the total generation from ISGS. Private sector generation added 132 MU, and the central sector provided the remaining output. These numbers illustrate a strong tilt toward solar and wind within interstate renewable generation, underscoring the effectiveness of recent capacity expansion initiatives.
Regional and Sectoral Distribution of ISGS Generation
Although the raw data does not list exact regional totals, the mention of northern, western, and southern regions suggests a balanced geographic spread. The leading states, such as those hosting Bikaner‑1, Bhadla‑1 and Bhadla‑2 projects, demonstrate higher generation capacities. Sector‑wise, solar dominates with over 7,500 MU, followed closely by wind at more than 5,300 MU. The private sector’s modest 132 MU reflects emerging participation, while the central sector’s contribution remains comparatively smaller, indicating room for growth in centrally managed projects.
Impact on Sectors and Industries
These generation trends influence multiple facets of the Indian economy. For the renewable equipment manufacturing sector, higher solar and wind outputs drive demand for panels, turbines, and balance‑of‑system components. Investors gain confidence from the clear performance of top ISGS players such as EESPL QCA Bhadla‑1 and Bhadla‑2, prompting further capital allocation. Policymakers can leverage this data to fine‑tune incentives, grid integration strategies, and regional planning, ensuring that transmission networks keep pace with the expanding renewable output.
Key Takeaways
- July 2024 ISGS renewable generation totalled 12,897.78 MU.
- Solar contributed 7,544 MU, representing the largest share.
- Wind generation followed with 5,354 MU, together exceeding 95% of output.
- Private sector added 132 MU, highlighting nascent participation.
- Top ISGS players include EESPL QCA Bhadla‑1, Bhadla‑2, and Fatehgarh projects.
- Regional performance suggests strong contributions from northern and western states.
FAQs
What is the total renewable generation from ISGS in July 2024?
The total reached approximately 12,898 million units (MU).
Which renewable source leads ISGS generation?
Solar power leads with about 7,544 MU.
How much did wind power generate?
Wind contributed roughly 5,354 MU.
Which sectors are involved in ISGS generation?
Solar, wind, private, and central sectors all contribute, with solar and wind dominating.
Who are the top ISGS players?
Key players include EESPL QCA Bhadla‑1, Bhadla‑2, and the Fatehgarh projects.