
Introduction
The June 2026 peak power demand report for North India provides a detailed snapshot of electricity consumption across the region’s major states. Understanding which states draw the most power during peak periods helps utilities, policymakers, and investors plan infrastructure upgrades, manage grid stability, and forecast future energy needs. This article breaks down the data statewise, highlights trends, and explains the broader impact on the power sector.
What Does the Data Reveal About This Topic?
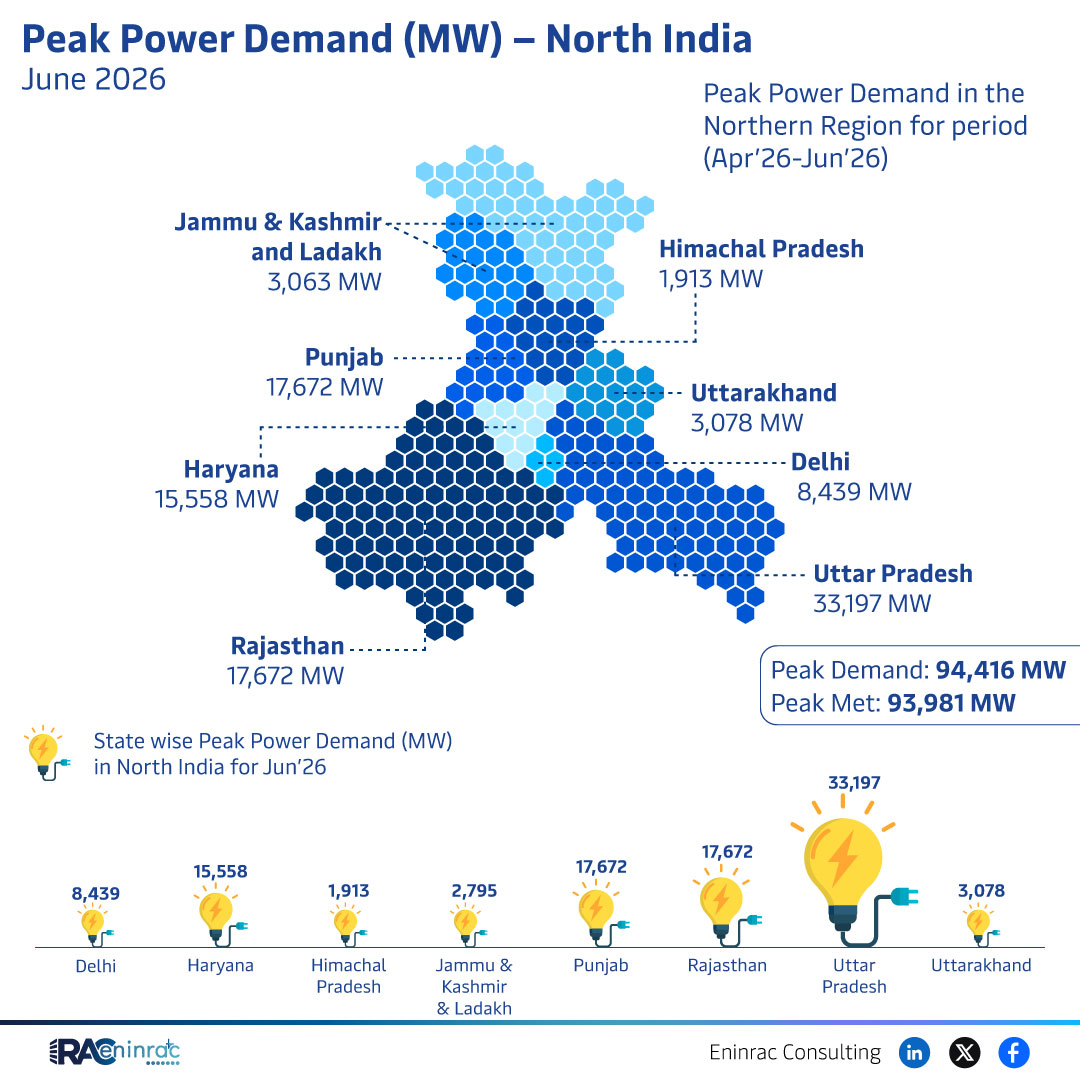
What does the June 2026 figure tell us about regional electricity stress? The data shows that Uttar Pradesh leads with a staggering 33,197 MW, followed by Rajasthan at 17,672 MW and Haryana at 15,558 MW. Smaller states such as Himachal Pradesh (3,063 MW), Uttarakhand (3,078 MW), Delhi (8,439 MW), and Jammu & Kashmir (1,913 MW) contribute significantly lower peaks, indicating varied load patterns across the northern belt.
Statewise Peak Demand Comparison
Comparing the numbers reveals a clear hierarchy of demand. Uttar Pradesh’s demand surpasses the combined total of the next three states, underscoring its massive industrial base and population. Rajasthan and Haryana, both with over 15,000 MW, demonstrate strong growth driven by manufacturing and expanding urban centers. In contrast, the Himalayan states of Himachal Pradesh and Uttarakhand show modest peaks below 3,100 MW, reflecting their lower industrial activity and higher reliance on renewable sources. Delhi, despite being a metropolitan hub, registers 8,439 MW, a figure that balances commercial consumption with aggressive demand‑side management programs.
Impact on Sectors and Industries
The peak demand figures influence multiple sectors. Power generators must align capacity additions with the highest‑demand states to avoid shortages. Transmission operators focus on reinforcing corridors that serve Uttar Pradesh, Rajasthan, and Haryana, reducing congestion risks. Investors look at these hotspots for opportunities in renewable integration, energy storage, and grid modernization. Policymakers leverage the data to design demand‑response incentives, especially in high‑need areas, while consumers benefit from improved reliability and potentially lower tariffs as capacity gaps are addressed.
Key Takeaways
- Uttar Pradesh records the highest June 2026 peak at 33,197 MW.
- Rajasthan and Haryana both exceed 15,000 MW, indicating strong growth.
- Himachal Pradesh and Uttarakhand stay below 3,100 MW, highlighting lower industrial load.
- Delhi’s 8,439 MW peak reflects balanced urban demand and efficiency measures.
- Total north‑region peak demand reaches 94,416 MW, stressing grid coordination.
- Targeted infrastructure investment is essential for the top three demand states.
FAQs
Which state has the highest peak power demand in June 2026?
Uttar Pradesh leads with a peak demand of 33,197 MW.
How does Rajasthan’s demand compare to Haryana’s?
Rajasthan records 17,672 MW, slightly higher than Haryana’s 15,558 MW.
Why are the Himalayan states’ peaks relatively low?
Their lower industrial activity and higher renewable penetration keep peaks under 3,200 MW.
What total peak demand does North India face in June 2026?
The combined peak demand across the northern states is 94,416 MW.
How can utilities use this data?
Utilities can plan capacity upgrades, reinforce transmission lines, and design demand‑response programs where peaks are highest.