
Introduction
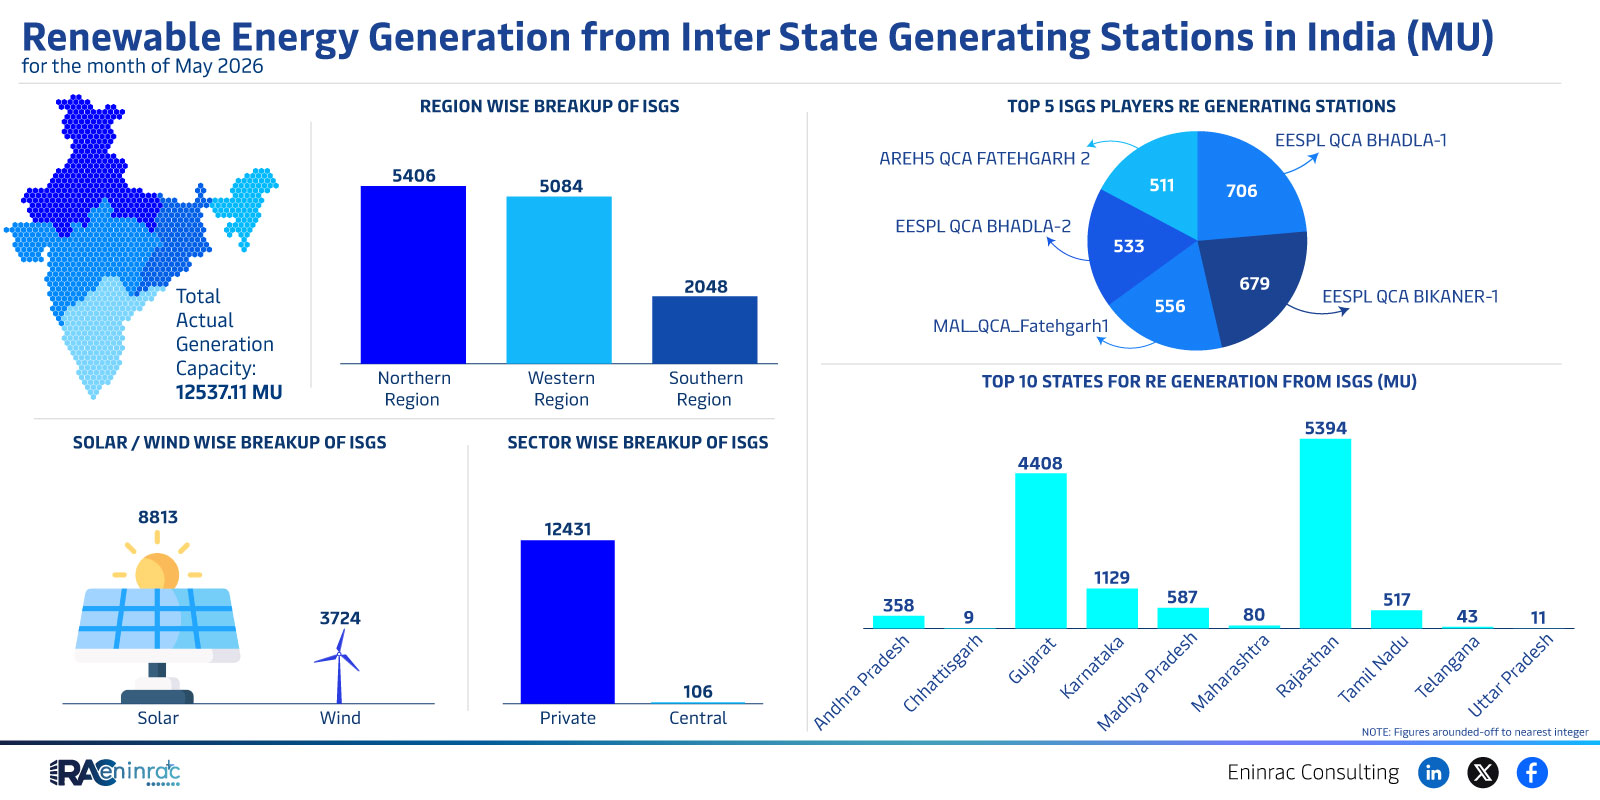
Renewable energy generation from inter‑state generating stations (ISGS) in India reached 12,537.11 MU in May 2026. This figure represents the combined output of solar, wind, private and central facilities that operate across state boundaries. Understanding the distribution of this generation helps policymakers, investors and industry analysts gauge the pace of clean‑energy transition, identify regional strengths and plan future capacity expansion.
What Does the Data Reveal About This Topic?
The data shows that the total renewable output in May 2026 was 12,537 MU, with the Northern region contributing the largest share of 5,406 MU, followed by the Western region at 5,084 MU and the Southern region at 2,048 MU. Solar accounted for roughly 3,724 MU, while wind contributed about 106 MU. Private and central sector plants together supplied the remainder, indicating a balanced mix of ownership models.
Regional and Technology Breakdown of ISGS Output
When the numbers are compared, the Northern region outperforms the South by more than double, suggesting better solar irradiance, larger installed capacity or more efficient grid integration in states such as Punjab, Haryana and Rajasthan. The Western region, driven by Gujarat and Maharashtra, shows a comparable performance, highlighting the importance of both solar farms and emerging wind projects in that area. Solar dominates the technology mix, delivering over 70 % of total ISGS generation, whereas wind remains a modest contributor. Private players, exemplified by entities like MAL_QCA_Fatehgarh1 and EESPL QCA Bikaner‑1, are increasingly active, reflecting a shift toward market‑driven renewable development alongside traditional central utilities.
Impact on Sectors and Industries
The surge in inter‑state renewable generation influences multiple sectors. Power utilities benefit from diversified supply sources, reducing reliance on coal and improving grid stability. Financial institutions see new credit opportunities in financing solar parks and wind farms that operate across state borders. Equipment manufacturers experience higher demand for photovoltaic panels, inverters and wind turbines, while logistics firms handle increased transport of renewable components. For policymakers, the data underscores the need for coordinated transmission planning and supportive tariff structures to sustain growth.
Key Takeaways
- The total renewable generation from ISGS in May 2026 was 12,537 MU.
- Northern India led the output with 5,406 MU, followed closely by the West.
- Solar contributed over 3,700 MU, accounting for more than 70 % of the mix.
- Wind generation remained limited at roughly 106 MU.
- Private sector plants are playing an increasingly prominent role.
- Regional disparities highlight where future capacity additions can be most impactful.
FAQs
Which region generated the most renewable energy in May 2026?
The Northern region, with 5,406 MU, was the top producer.
How much solar energy was produced by ISGS?
Solar accounted for approximately 3,724 MU of the total generation.
What share did wind energy have in the May 2026 ISGS output?
Wind contributed about 106 MU, representing a small fraction of the total.
Are private companies significant contributors to ISGS generation?
Yes, private players such as MAL_QCA_Fatehgarh1 and EESPL QCA Bikaner‑1 are among the top generators.
What does this data mean for future renewable investments?
It signals strong growth potential in northern and western states, encouraging investors to focus on solar projects and cross‑state partnerships.