
Introduction
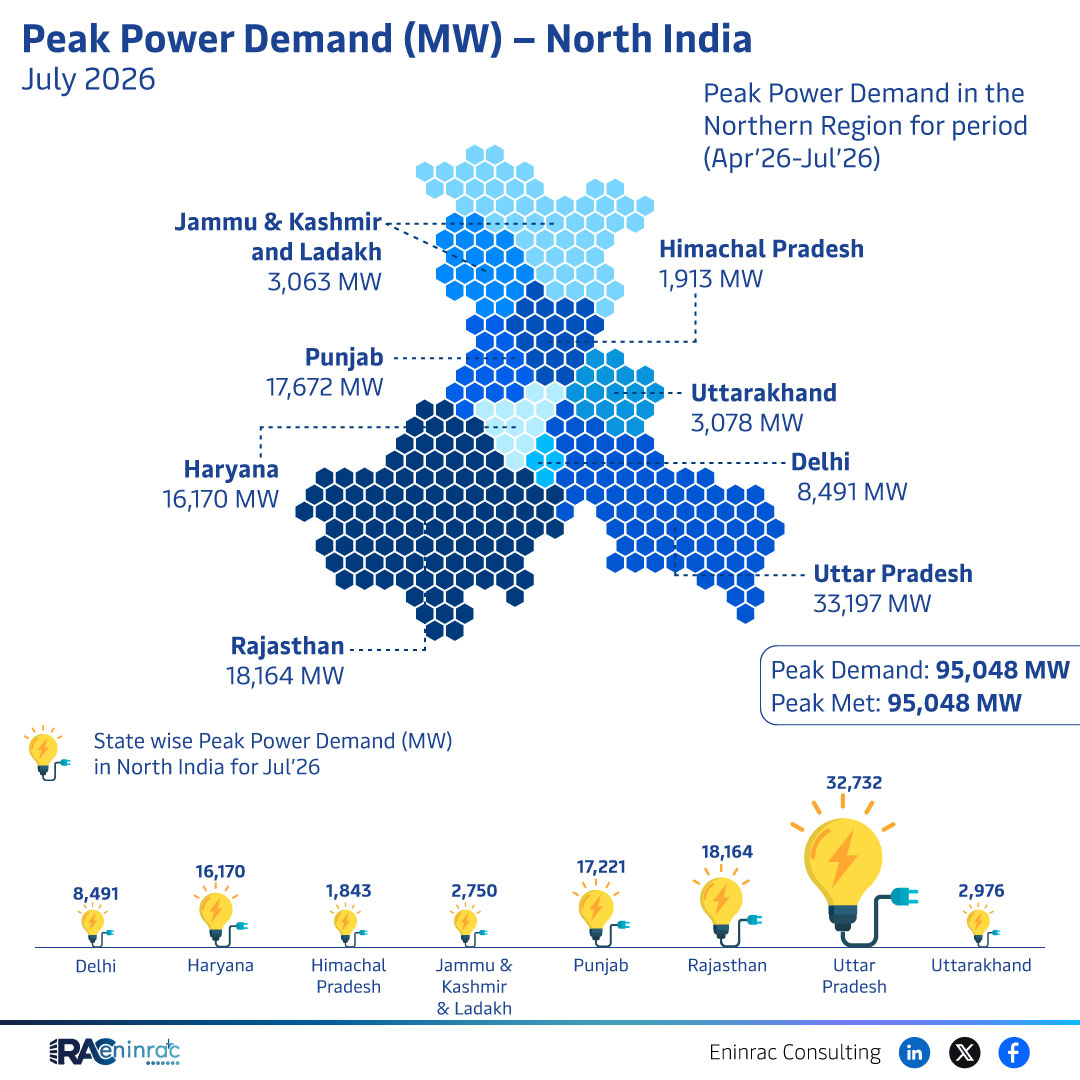
The July 2026 power statistics for North India highlight a total peak demand of 95,048 MW across the region. Understanding the distribution of this load is crucial for grid operators, policymakers, investors, and consumers alike. This article breaks down the state‑wise figures, examines the drivers behind the numbers, and discusses the broader implications for the power sector in the northern part of the country.
What Does the Data Reveal About This Topic?
What insights does the July 2026 data provide about North India peak power demand? The figures show that Uttar Pradesh dominates the region with a staggering 33,197 MW, followed by Rajasthan at 18,164 MW and Haryana contributing 16,170 MW. Smaller states such as Himachal Pradesh, Uttarakhand, and the union territories register significantly lower peaks, underscoring regional variations in industrial activity, population density, and climate‑driven consumption patterns.
State‑wise Comparison of July 2026 Peak Demand
When comparing the numbers, Uttar Pradesh’s demand exceeds the combined total of several neighboring states, reflecting its large population and extensive industrial base. Rajasthan’s peak load, driven by growing manufacturing and tourism, places it firmly in second position. Haryana’s demand is fueled by its proximity to the national capital and a thriving services sector. Delhi, though a city‑state, records 8,491 MW, while Punjab’s demand sits around 17,221 MW. The Himalayan states—Himachal Pradesh (1,913 MW), Uttarakhand (3,078 MW), and Jammu & Kashmir‑Ladakh (3,063 MW)—show modest peaks, indicating limited industrialisation and lower temperature extremes during the summer months.
Impact on Sectors and Industries
High peak power demand influences multiple facets of the economy. For utilities, it means tighter capacity planning, more frequent reliance on supplemental generation, and heightened transmission constraints. Industries in high‑demand states may face elevated tariffs during peak periods, prompting investments in demand‑side management and renewable integration. Investors watch these trends to gauge the attractiveness of power‑related assets, while policymakers must balance reliability with sustainability goals, especially as the region pushes toward cleaner energy mixes.
Key Takeaways
- North India’s total July 2026 peak demand reached 95,048 MW.
- Uttar Pradesh led with 33,197 MW, accounting for over one‑third of the regional load.
- Rajasthan and Haryana together contributed more than 34,000 MW.
- Delhi’s demand exceeded 8,000 MW despite its smaller geographic size.
- Himachal Pradesh, Uttarakhand, and Jammu & Kashmir‑Ladakh recorded the lowest peaks.
- Peak demand patterns highlight the need for targeted grid upgrades and demand‑side solutions.
FAQs
Why did Uttar Pradesh have the highest peak demand?
Its large population, extensive manufacturing base, and agricultural activities drive higher electricity consumption, especially during summer.
How does Delhi’s demand compare to the surrounding states?
Delhi’s 8,491 MW is lower than neighboring Haryana and Punjab but higher than the Himalayan states, reflecting its dense urban load.
What challenges do utilities face with a 95,048 MW peak?
Utilities must ensure sufficient generation, manage transmission bottlenecks, and maintain grid stability while integrating more renewable sources.
Can renewable energy meet these peak loads?
Renewables can contribute significantly, but storage and flexible generation are needed to cover short‑term peaks.
What actions can policymakers take to smooth peak demand?
They can promote energy efficiency programs, incentivize demand‑response, and accelerate grid modernization projects.