
Introduction
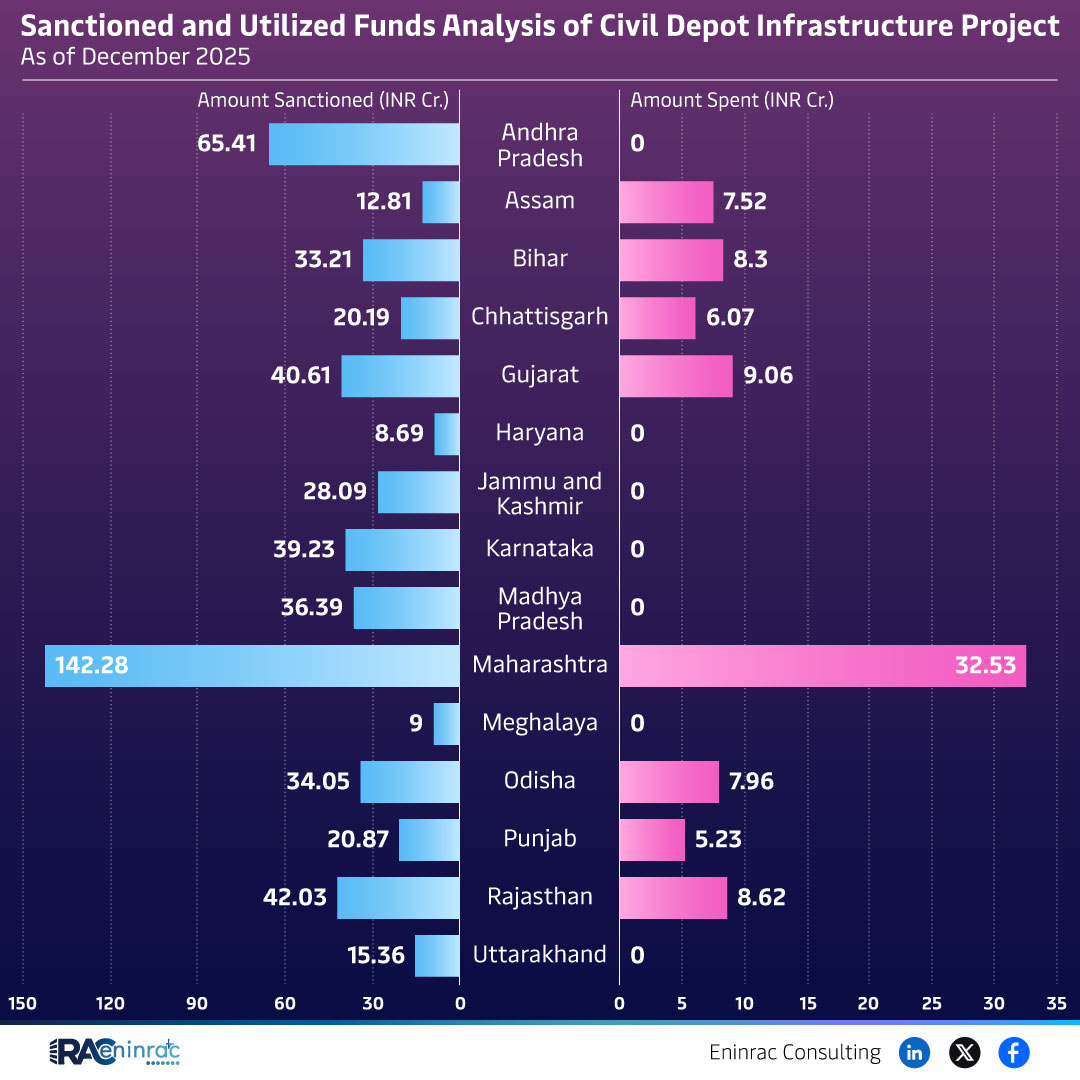
The 2025 Civil Depot Infrastructure Project analysis provides a clear snapshot of how central and state authorities allocated and utilized financial resources across Indian states. Understanding the split between sanctioned and spent amounts is essential for assessing fiscal discipline, project progress, and sectoral impact. This page walks the reader through the raw numbers, uncovers regional disparities, and explains why such financial tracking matters to investors, policymakers, and the public.
What Does the Data Reveal About This Topic?
Does the data suggest that all sanctioned funds are being fully utilized? The answer is no; while some states such as Gujarat and Maharashtra show high utilization ratios, others lag behind, indicating potential bottlenecks in project execution, funding release, or local capacity. The contrast between total sanctioned INR crore and actual spent INR crore highlights where financial planning aligns with on‑ground implementation and where gaps persist.
State-wise Funding Allocation and Utilization
A comparative look at the figures shows that Andhra Pradesh received the highest sanctioned amount of 65.41 CR, yet its spent amount is not listed, suggesting incomplete reporting. Gujarat, with 40.61 CR sanctioned, reports spending of 6.07 CR, illustrating a modest utilization rate. Karnataka’s allocation of 39.23 CR contrasts with a spending figure of 9.06 CR, indicating better fund absorption. Smaller states like Meghalaya and Uttarakhand display lower allocations and minimal spending, which could reflect limited project scope or delayed disbursement. Overall, the data underline significant regional variation in how sanctioned and utilized funds are managed.
Impact on Sectors and Industries
Sanctioned and utilized funds for civil depot infrastructure have cascading effects on construction, logistics, and regional development sectors. High utilization often correlates with increased procurement of materials, job creation, and improved supply chain efficiency, benefiting local economies. Conversely, under‑utilized allocations may signal stalled projects, affecting contractors, equipment manufacturers, and ancillary service providers. For investors, these trends provide insight into market opportunities and risk exposure, while policymakers can identify where to streamline approval processes or reinforce capacity building.
Key Takeaways
- Gujarat and Karnataka demonstrate higher fund utilization relative to their sanctioned amounts.
- Several states show large gaps between sanctioned and spent figures, indicating potential implementation delays.
- Regions with higher utilization tend to experience stronger construction sector activity.
- Under‑utilization may point to administrative bottlenecks or limited project readiness.
- Accurate tracking of sanctioned and utilized funds is crucial for transparent governance.
- Policymakers can use these insights to reallocate resources and improve project timelines.
FAQs
What is the purpose of tracking sanctioned versus spent funds?
Tracking helps assess project progress, ensures accountability, and identifies financial gaps that may hinder infrastructure development.
Which states have the highest utilization rates?
Karnataka and Gujarat show comparatively higher utilization, reflecting effective fund deployment and project execution.
Why might some states have low spending despite high allocations?
Factors include administrative delays, insufficient project readiness, or challenges in contractor mobilization.
How does fund utilization affect the construction industry?
Higher utilization drives demand for labor, materials, and equipment, boosting industry activity and local employment.
What actions can policymakers take to improve utilization?
Streamlining approval processes, enhancing capacity building, and monitoring disbursements can close the utilization gap.